
Figures & data
Table 1 Patient Characteristics
Table 2 Response to Osimertinib Therapy
Table 3 Univariate and Multivariate Analyses for Factors That May Influence Progression-Free Survival
Table 4 Univariate and Multivariate Analyses for Factors That May Influence Time to Treatment Failure
Figure 1 Kaplan–Meier curves showing (A) progression free survival (PFS) and (B) time to treatment failure (TTF) to osimertinib therapy.
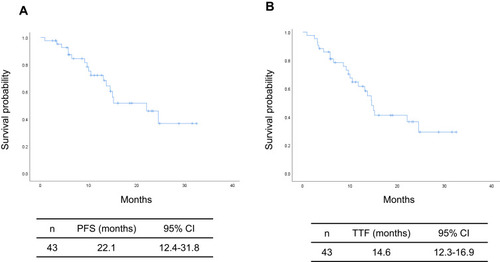
Figure 2 Kaplan–Meier curves showing (A) PFS and (B) TTF in patients receiving osimertinib therapy according to their Eastern Cooperative Oncology Group performance status score.
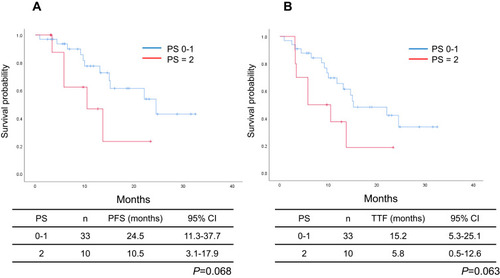
Table 5 Toxicities
Figure 3 Durations of treatment with osimertinib before disease progression or cessation owing to adverse events in individual patients.
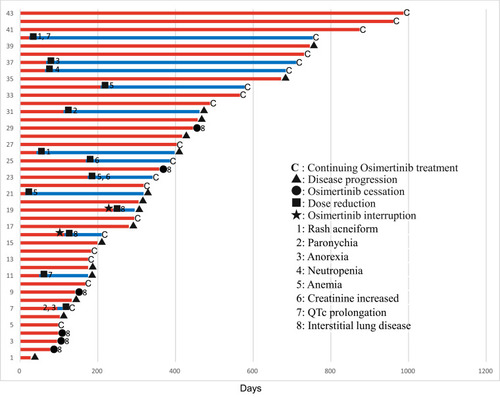
Table 6 Clinical Studies on Patients ≥75 Years of Age Who Were Treated with EGFR-TKIs