Figures & data
Figure 1 Recruitment criteria for eligible PINHL patients examined in our present study.
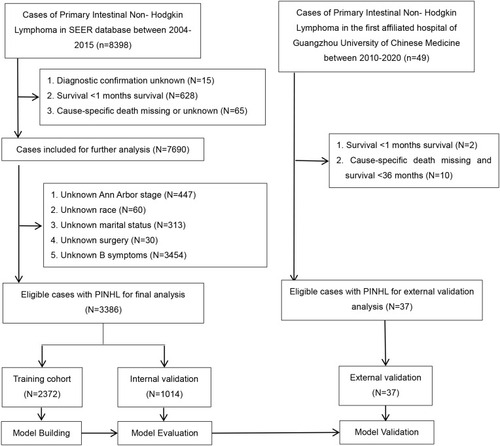
Table 1 Clinicopathological Characteristics of Patients in the Training, Internal and External Validation Cohorts (N(%))
Figure 2 Kaplan–Meier survival curves for OS (A) and CSS (B) in all the 3386 patients from the SEER database.
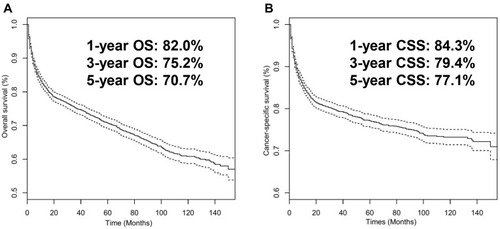
Table 2 Univariable and Multivariable Analyses of Cancer-Specific Survival in the Training Cohort
Figure 3 Newly developed nomogram for predicting 1-, 3-, and 5-year CSS in PINHL patients.
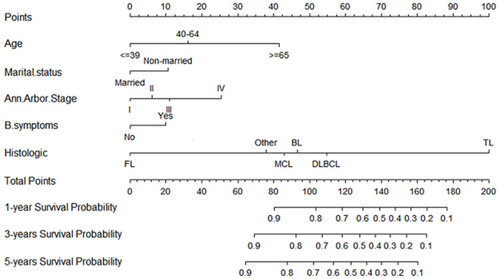
Figure 4 ROC curves for the nomogram’s prediction of 1-, 3-, and 5-year CSS in the training cohort (A), internal validation cohort (B), and external validation cohort (C).
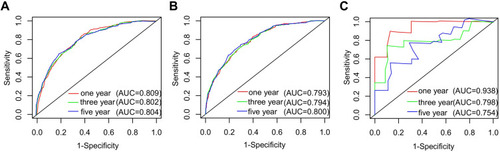
Figure 5 Calibration curve for predicting 1-, 3-, and 5-year CSS of PINHL patients in the training (A–C), internal validation (D–F), and external validation cohorts (G–I).
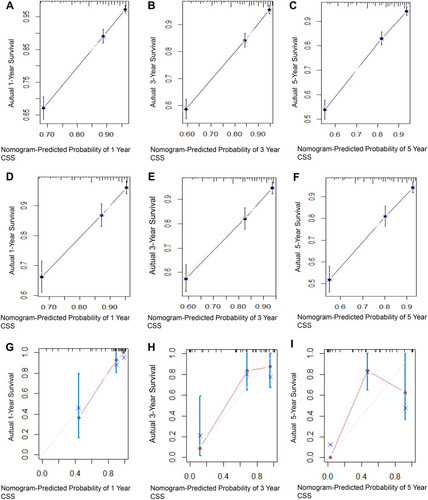
Figure 6 Decision curve analysis of the nomogram’s ability to predict 5-year CSS in PINHL patients in the training (A), internal validation (B), and external validation cohorts (C). The gray and black lines represent the assumption for all the patients with and without CSS, respectively. The black dotted line represents the nomogram, and the red dotted line represents the Ann Arbor Stage.
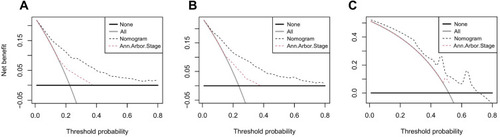
Figure 7 An example used to illustrate usage of the web-based survival-rate calculator. A 68-year-old married man with PINHL was diagnosed as DLBCL with Ann Arbor Stage IV and presenting with B symptoms (A). The patient’s survival plot according to the web survival-rate calculator (B). The patient’s 5-year CSS rate is approximately 40.0 (95% CI 33.0–49.0) (C).
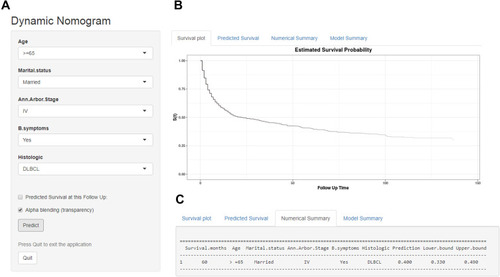
Figure 8 ROC curves used to assess the performance of the nomogram and Ann Arbor Stage prognostic systems in predicting 5-year CSS in the training (A), internal validation (B), and external validation cohorts (C).
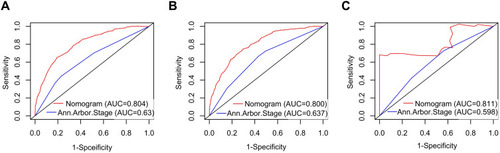
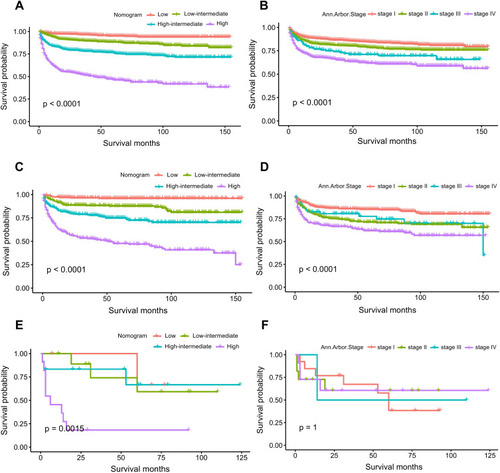
Figure 9 Kaplan–Meier survival curves showing the risk levels determined using the nomogram and Ann Arbor Stage system in the training (A and B), internal validation (C and D), and external validation cohort (E and F).