
Figures & data
Table 1 Socio-Demographic Characteristics of Breast Cancer Patients in Northwest Ethiopia, 2015–2020
Table 2 Log Rank Test for Equality of Survival Function of Patients with Breast Cancer Diagnosed in Northwest Ethiopia, 2015–2020
Figure 1 Plot of the overall estimate of Kaplan–Meier survivor function of breast cancer patients in Northwest Ethiopia, 2015–2020.
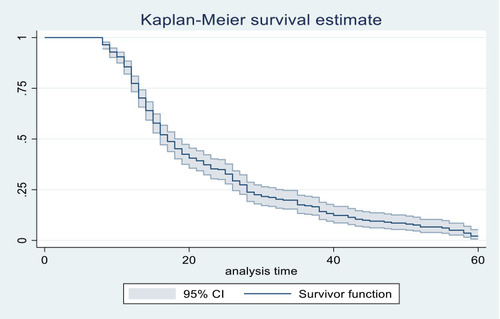
Figure 2 Kaplan–Meier survival estimates of patients with breast cancer diagnosed by age groups in Northwest Ethiopia, 2015–2020.
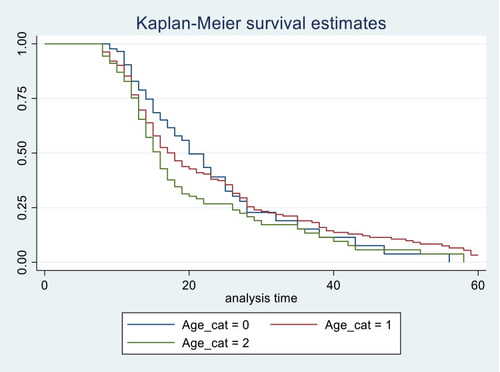
Table 3 Multivariable Cox Regression Analysis Model for Survival of Breast Cancer Patients Diagnosed in Northwest Ethiopia, 2015–2020