Figures & data
Figure 1 Flow chart of this research.
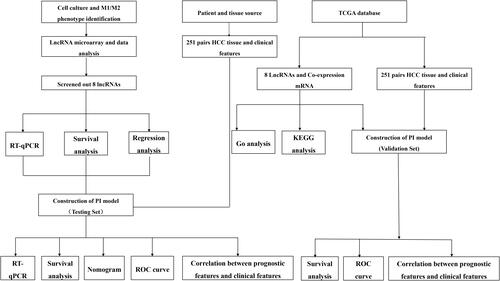
Figure 2 Acquisition of LncRNAs from M1 and M2 macrophages. (A) Amount of differentially expressed LncRNAs and total LncRNAs. (B) Heatmap of differentially expressed LncRNAs (LogFC >1 q-value < 0.05). Red color represents upregulation and blue represents downregulation. (C) Volcan plot of differentially expressed LncRNAs (LogFC >1 q-value < 0.05). Volcano plot showing the differentially expressed genes. Red color represents upregulation and blue represents downregulation.
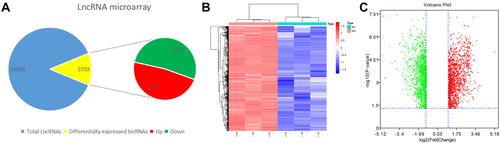
Figure 3 Expression of 8 lncRNAs in 251 pairs of matched HCC tissues and adjacent normal tissues. *p < 0.05, **p < 0.01, ***p < 0.001, ****p < 0.0001. (A) ADPGK-AS1, (B) FOXP4-AS1, (C) GMDS-DT, (D) ZBED5-AS1 (E) LAMTOR5-AS1, (F) LINC01160, (G) NRSN2-AS1, (H) SEMA6A-AS1.
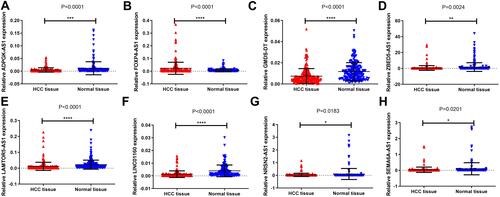
Figure 4 KM curve of 8 lncRNAs in 251 pairs of matched HCC tissues and adjacent normal tissues. (A) ADPGK-AS1, (B) FOXP4-AS1, (C) GMDS-DT, (D) ZBED5-AS1. (E) LAMTOR5-AS1, (F) LINC01160, (G) NRSN2-AS1, (H) SEMA6A-AS1.
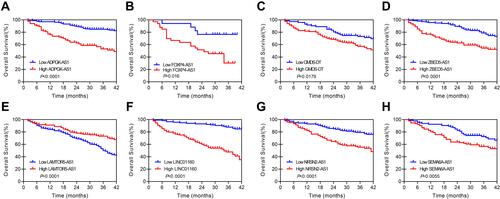
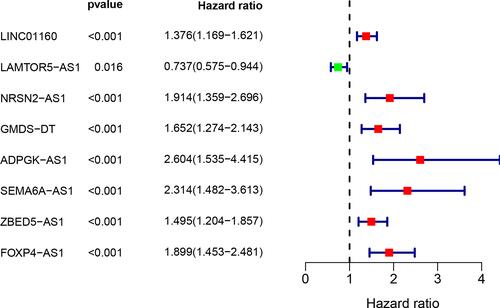
Figure 5 A univariate Cox analysis of 8 differentially MAls based on clinical dataset. P value less than 0.05 was considered significant.