Figures & data
Figure 1 Flow chart of study design.
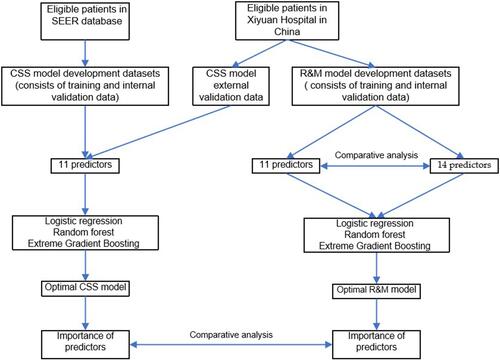
Table 1 Study Outcomes of the CSS Model
Table 2 Study Outcome of the R&M Model
Figure 2 (A) Flow chart of included patients (SEER database). (B) Flow chart of included patients (Xiyuan Hospital in Beijing, China).
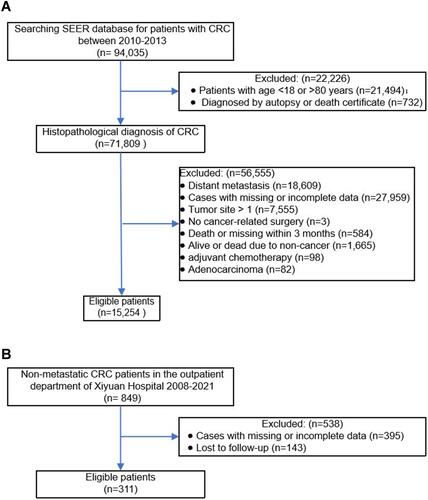
Figure 3 Model AUCs for one-, three-, and five-year CSS. The curves for models (logistic regression (LR), extreme gradient boosting (XGBoost), random forest (RF) regression and external validation based on XGBoost)) in cancer-specific survival (CSS) of non-metastatic colon cancer. The 45-degree straight line represents that the model has similar chances of correctly classifying patients with vs patients without events. AUC=area under the receiver operating characteristic curve.
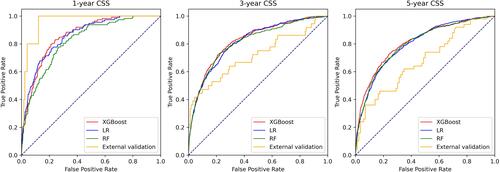
Table 3 AUCs of Various Predictors in R&M Model
Figure 4 Model AUCs for one-, three-, and five-year R&M model with 11 predictors. The curves for models (logistic regression (LR), extreme gradient boosting (XGBoost), random forest (RF) regression) in recurrence and metastasis (R&M) of non-metastatic colon cancer. The 45-degree straight line represents that the model has similar chances of correctly classifying patients with vs patients without events.
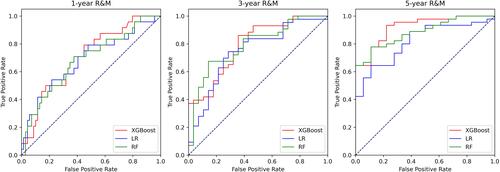
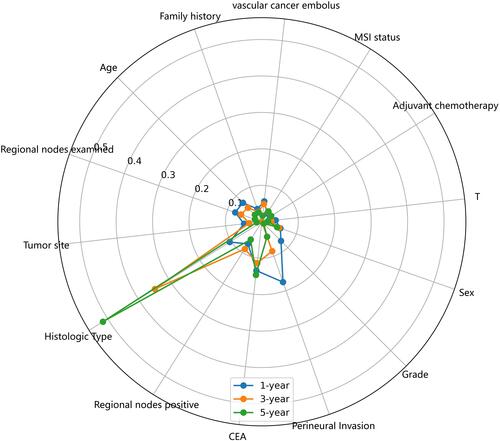
Figure 5 Radar plot for importance of predictors in CSS and R&M models with 11 predictors.
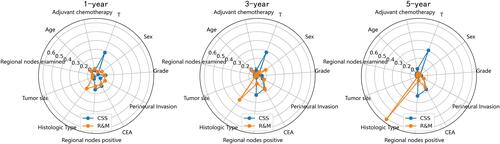
Figure 6 Radar plot for importance of predictors in R&M model with 14 predictors.