Figures & data
Table 1 Main Baseline Demographic and Clinical Characteristics of Patients in the Training and Validation Cohorts
Table 2 Preoperative Clinical Risk Factors for Overall Survival in Patients with HCC
Table 3 Test the Proportional Hazards Assumption of Clinical Characteristic Using Schoenfeld Residual Test
Figure 1 Visualization of Schoenfeld residual test of proportional hazards assumption for clinical characteristics.
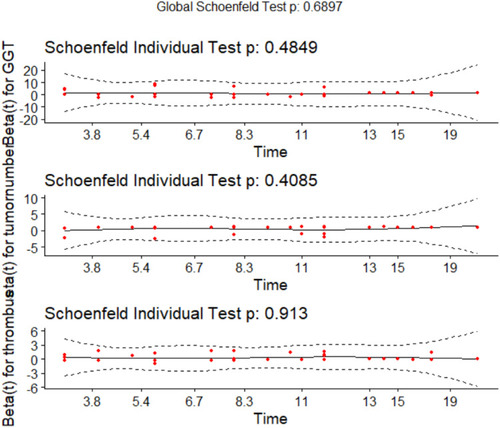
Table 4 The Median Survival Time and Survival Rate According to Risk Stratification
Figure 2 Kaplan–Meier analysis of risk score with overall survival (OS). (A) Patients with low-risk score (separated by the cut-off value of 2.00) demonstrated significant longer OS compared to patients with high-risk score in the training cohort (p < 0.0001). (B) Patients with low-risk score (≤ 2.00) showed longer OS than patients with high-risk score in the test cohort (p = 0.00014).
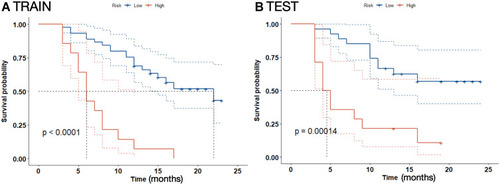
Figure 3 A nomogram to predict the 6-, 12- and 18-month survival rates for patients in the training cohort.
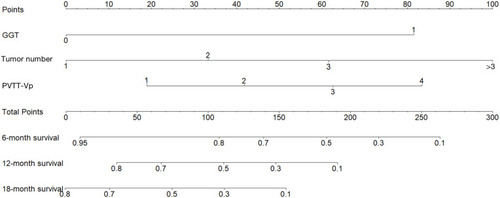
Figure 4 ROC curves for the nomogram at 6-, 12- and 18-month in the training cohort (A) and test cohort (B).
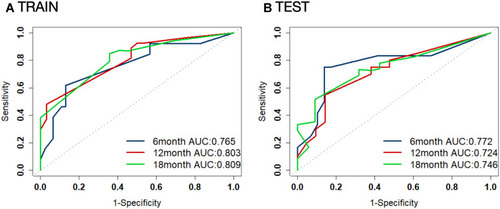
Figure 5 Time-dependent ROC curves to show the trend of AUC values over time both in the training and test cohorts.
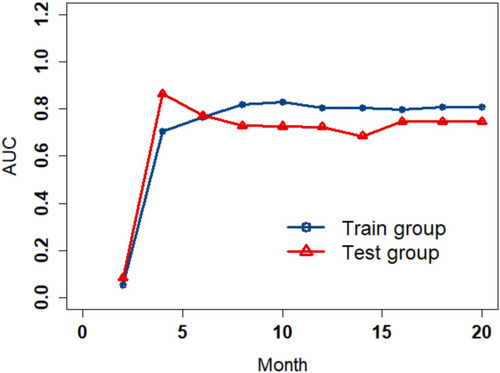
Figure 6 Calibration curves to evaluate the performance of the nomogram in 6-, 12- and 18-month survival rates in the training (A–C) and test (D–F) cohorts.
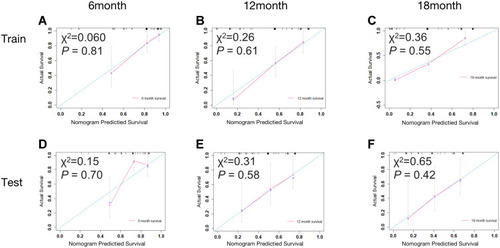
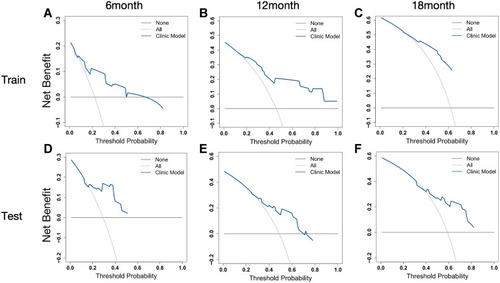
Figure 7 Decision curve analysis for overall survival at 6-, 12- and 18-month in the training cohort (A–C) and test cohort (D–F). Black line: All patients dead. Gray line: None patients dead. Blue line: Model of nomogram.