
Figures & data
Figure 1 CONSORT 2010 flow diagram.
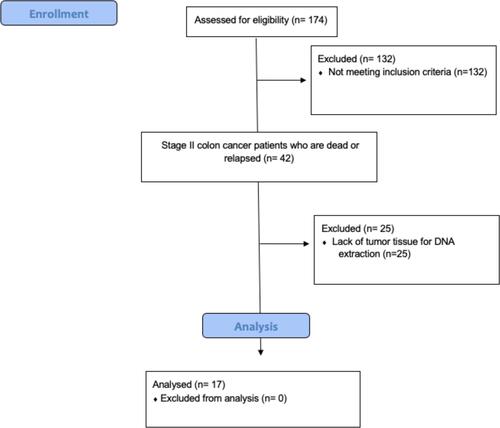
Figure 2 The Cancer Genome Atlas Colon Adenocarcinoma Cohorts (TCGA COAD) stage II CRCs.
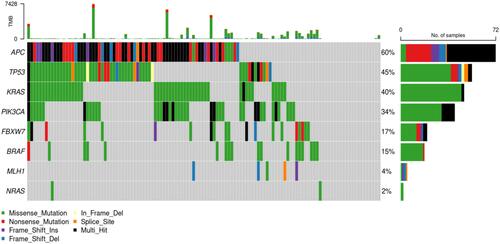
Figure 3 The Cancer Genome Atlas Colon Adenocarcinoma Cohorts (TCGA COAD) stage II non recurred CRCs.
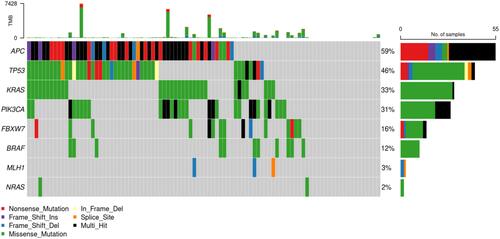
Figure 4 The Cancer Genome Atlas Colon Adenocarcinoma Cohorts (TCGA COAD) stage II recurred CRCs.
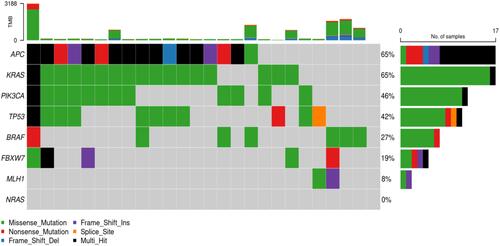
Table 1 Clinicopathologic Features of Patients
Table 2 Genomic Profile and Clinicopathological Characteristics of Relapsed CRC Patients
Figure 5 Frequency and representation of gene mutations in cohort study. Vertical axis: frequency of mutations. Horizontal axis: genes.
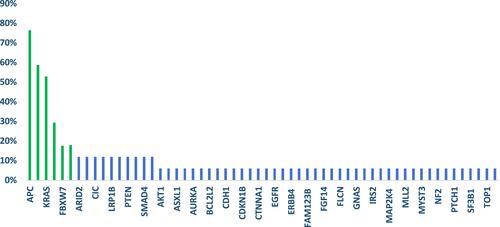
Figure 6 STRING network analysis of relevant gene mutations (N=17 patients). *Log10 (observed/expected). This measure describes how large the enrichment effect is. It’s the ratio between i) the number of proteins in your network that are annotated with a term and ii) the number of proteins that we expect to be annotated with this term in a random network of the same size. #This measure describes how significant the enrichment is. Shown are p-values corrected for multiple testing within each category using the Benjamini–Hochberg procedure.
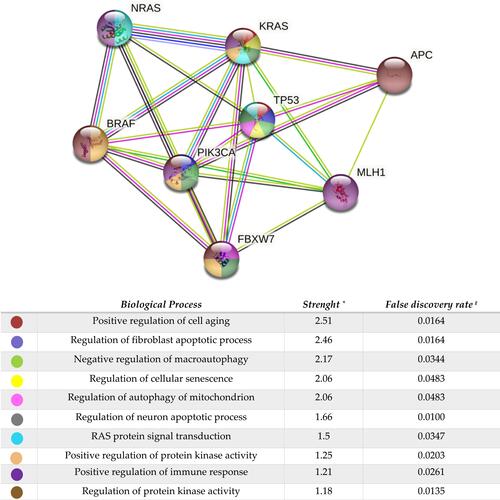
Table 3 Univariate Analysis for Disease Free Survival (DFS) and Overall Survival (OS)