Figures & data
Table 1 The Number of Patients in Different Scores Based on Immunohistochemistry Staining
Figure 1 Expression of ACTL6A in PC and normal tissues. (A) Differential expression of Actl6a mRNA between pancreatic tumor and normal tissues. (B) Immunohistochemical results of typical normal tissues and PC tissues with different staining intensities. (C) Differential expression of ACTL6A between pancreatic tumor and normal tissues. (D) ACTL6A represented a moderate diagnostic value. The ROC of pancreatic cancer samples and normal tissues. (E) ROC for the diagnostic efficiency of ACTL6A, serum CEA, and serum CA19–9. *p<0.05.
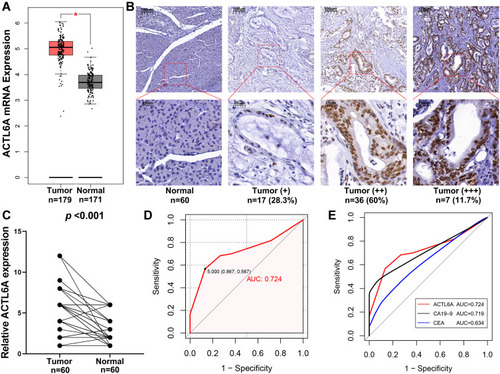
Table 2 Relationships Between the Expression Level of ACTL6A and the Clinicopathological Characteristics of PC Patients
Figure 2 (A) Kaplan–Meier curves of overall survival in PC patients with high and low Actl6a mRNA expression. (B) Kaplan–Meier curves of overall survival in PC patients with high and low ACTL6A expression.
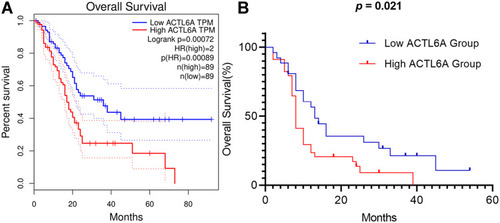
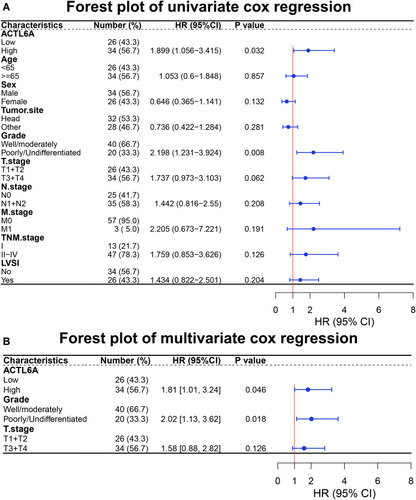
Table 3 Univariate and Multivariate Analysis of Clinicopathological Characteristics Affecting Prognosis of Patients with PC
Figure 3 Forest plot of univariate (A) and multivariate (B) cox regression.