
Figures & data
Table 1 Characteristics of the Low and High PCI Groups
Table 2 Independent Predictors of High PCI
Figure 2 Receiver operating characteristic curves for discriminating patients with low PCI (<15) and high PCI (≥15). (A) neutrophil–lymphocyte ratio, (B) platelet–lymphocyte ratio, (C) D-dimer.
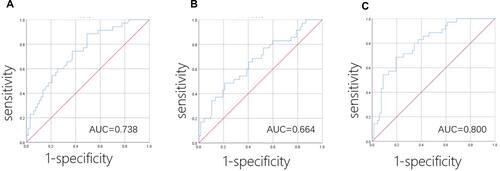
Table 3 Relationship Between PCI and the NPD Score
Figure 3 Receiver operating characteristic curves for discriminating patients with low PCI (<15) and high PCI (≥15) according to NPD score.
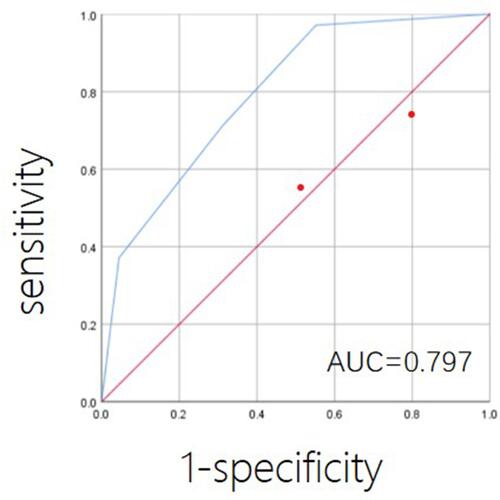
Table 4 Relationship Between Prognosis and the NPD Score
Figure 4 Kaplan–Meier survival curves according to the NPD score.
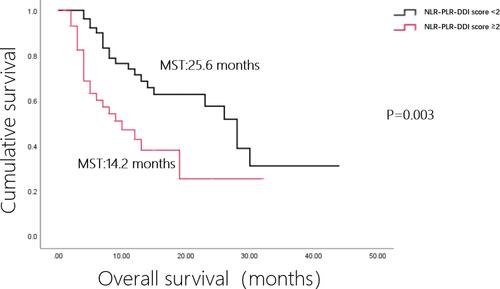
Table 5 Univariate and Multivariate Analyses of Overall Survival
Table 6 Characteristics of PCI Decrease <6 Group and ≥6 Group
Figure 5 Flow-chart with the exclusion criteria for DSL.
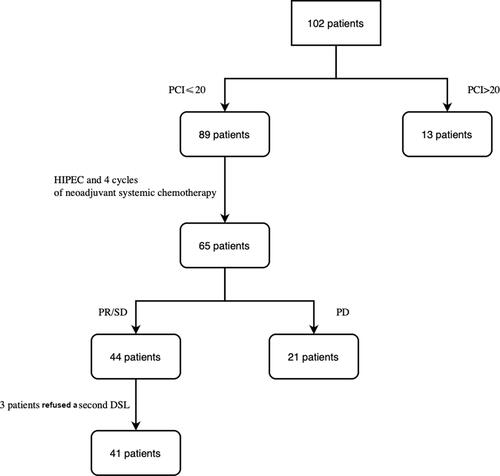
Table 7 Univariate and Multivariate Analysis of PCI Decrease