Figures & data
Figure 1 Immunohistochemical staining of ER and PR expressions. (1Ai, 1Aii) (cervical squamous cell carcinoma with stage IB1) and (1Bi, 1Bii) (cervical squamous cell carcinoma with stage IB1) show the positive and negative ERα expression, respectively; (1Ci, 1Cii) (cervical adenocarcinoma with stage IB1) and (1Di, 1Dii) (cervical squamous cell carcinoma with stage IB1) show the positive and negative PR expression, respectively. (1Aii, 1Bii, 1Cii and 1Dii) are the enlarged images of (1Ai, 1Bi, 1Ci and 1Di), respectively. Tumor cells and stromal cells with positive ERα and PR expression display yellow or brown granules in the nucleus.
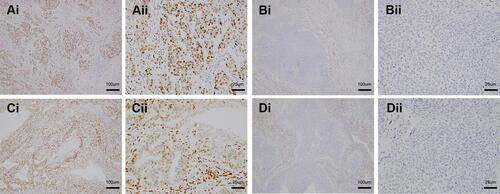
Table 1 Preoperative Clinical Characteristics and Immunohistochemistry Findings of Patients with LNM or without LNM
Table 2 Univariate and Multivariate Analyses of Preoperative Risk Factors for LNM by Binary Logistic Regression Models
Table 3 Predictive Model Performance and Preoperative Variables for LNM
Table 4 Predictive Performance of Pathological Risk Factors and Adjuvant Radiotherapy for the Low-Risk Group
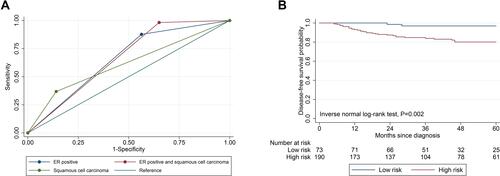
Figure 2 (A) ROC curves for LNM prediction: ERα positive, squamous cell carcinoma, and predictive performance. (B) Secondary outcomes: 5-year DFS of the predictive performance for LNM. Low risk (ERα positive and squamous cell carcinoma); High risk (ERα negative and/or non-squamous cell carcinoma).