Figures & data
Table 1 Pharmacokinetics of granisetron
Figure 1 Plasma concentrations of granisetron resulting from repeated oral dosing (2 mg daily) and the Sancuso 52 cm2 TD patchCitation17 in normal volunteers.
Note: The patch was removed at the end of day 6 (144 hours).
Abbreviations: TD, transdermal; ng/mL, nanogram/milliliter.
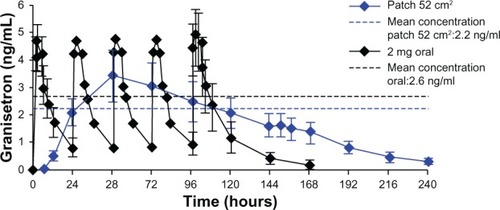
Figure 2 Plasma concentration in patients treated with the TD granisetron patch.
Note: Plasma concentration–time curve is very similar to that observed in normal subjects ().
Abbreviations: TD, transdermal; ng/mL, nanogram/milliliter.
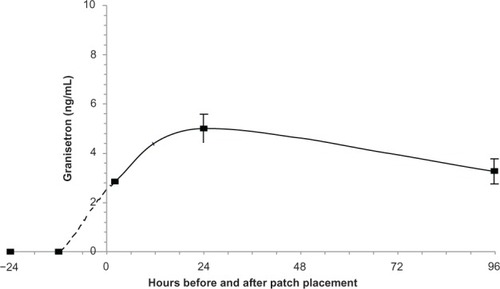
Table 2 IC50 for hERG cardiac K+ channel inhibition
Table 3 Incidence of most common adverse events
Table 4 Other 5-HT3 antagonist preparations and other drug therapies for CINV in current use or under development
Figure 3 Linear regression of granisetron plasma concentration and associated placebo-corrected change in baseline-subtracted QTcF in the TQTS sponsored by ProStrakan, Inc.Citation12
Notes: The slope of the relationship was 0.157 msec/9 ng/mL. The model predicted a ddQTcF at the maximum plasma concentration (26.1 ng/mL observed in the study of only 4.79 msec).
Abbreviations: QTcF, QT corrected by the Fridericia formula; TQTS, thorough QT study; ddQTcF, baseline and placebo subtracted QTcF; msec, millisecond; ng/ mL, nanogram/milliliter.
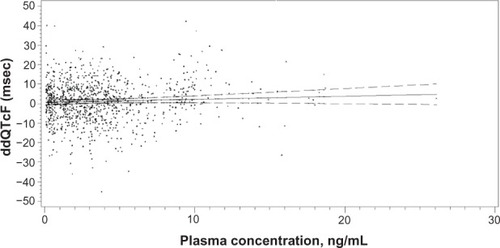
Figure 4 Linear regression the natural log of granisetron plasma concentration and associated placebo-corrected change in baseline-subtracted QTcF in the TQTS sponsored by AP Pharma Inc (2012).
Notes: The slope of the relationship was −0.1326 msec/9 ng/mL. The model predicted a ddQTcF at the maximum plasma concentration (82.1 ng/mL observed in the study of only 1.37 msec).
Abbreviations: QTcF, QT corrected by the Fridericia formula; ddQTcF, baseline and placebo subtracted QTcF; TQTS, thorough QT study; msec, millisecond; ng/ mL, nanogram/milliliter.
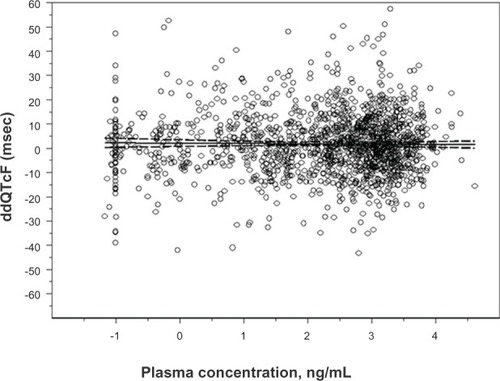
Table 5 Advantages and disadvantages of transdermal delivery of granisetron