Figures & data
Table 1 Patients Demographics and Disease Characteristics (n = 160)
Table 2 Patients and Disease Characteristics Stratified Based on Low and High NLR
Table 3 Multivariate Logistic Regression Analysis for ODX RS Cutoffs
Figure 1 Flow diagram for selection criteria.
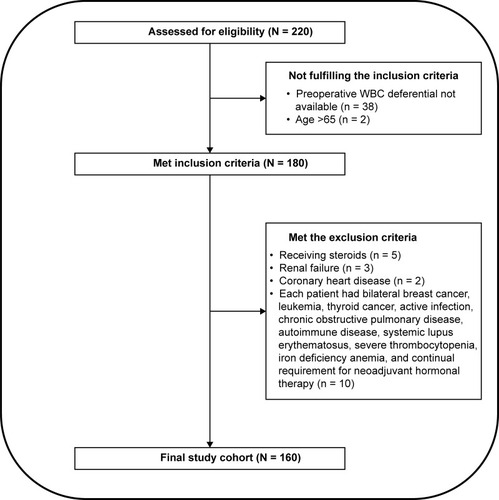
Figure 2 ROC curve showed that neutrophil-to-lymphocyte ratio associated with Oncotype Dx and the cutoff point of 2.15 revealed 0.81 and 0.60 sensitivity and specificity, respectively.
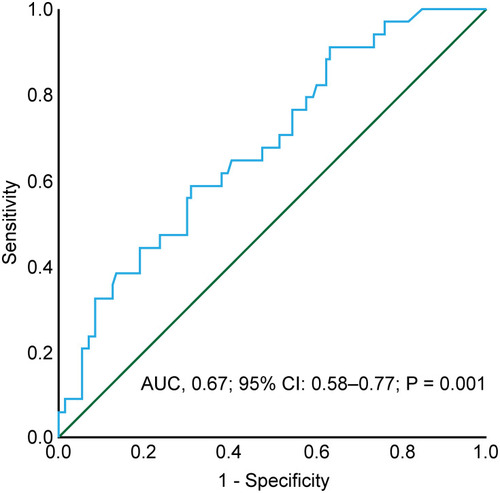
Figure 3 Illustration showing the patients’ Oncotype Dx (ODX RS) recurrence score distribution <26 (green) vs ≥26 (blue) in the following four groups: low neutrophil-to-lymphocyte ratio (NLR; < 2.15) and low grade (G1/2), low NLR and high grade (G3), high NLR (≥2.15), and low grade, and high NLR and high grade (A). Illustration showing the patients’ ODX RS <16 (green) vs ≥16 (blue) distribution in the four groups: absent (0), presence of any one (1), two (2), or all (3) of the following: high grade (G3), high NLR ≥ 2.15, or high Ki-67 (>20) (B).
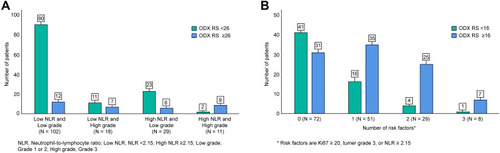
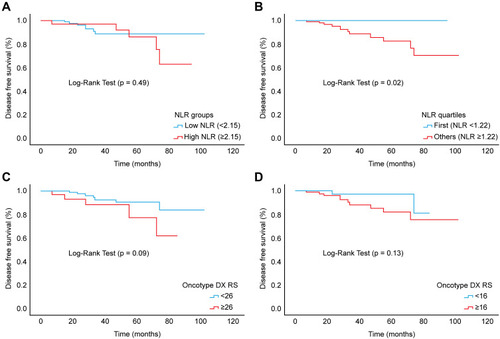
Figure 4 Disease-free survival of patients with neutrophil-to-lymphocyte ratio (NLR) of <2.15 vs ≥2.15 (A), NLR <1.22 vs ≥1.22 (B), Oncotype Dx (ODX RS) <26 vs ≥26 (C), and ODX RS <16 vs ≥16 (D).