Figures & data
Figure 1 Analysis of DEGs from GSE50760. (A) Heatmap illustrates the top 200 DEGs in GSE50760 according to FDR p values. (B) Volcano plot illustrates the DEGs in GSE50760. (C) GO_Biological Process enrichment of up-regulated DEGs from GSE50760. (D) GO_Cellular component enrichment of up-regulated DEGs from GSE50760. (E) GO_Molecular function enrichment of up-regulated DEGS from GSE50760. (F) KEGG pathway enrichment of up-regulated DEGs from GSE50760. (G) GO_Biological process enrichment of down-regulated DEGs from GSE50760. (H) GO_Cellular component enrichment of down-regulated DEGs from GSE50760. (I) GO_Molecular function enrichment of down-regulated DEGS from GSE50760. (J) KEGG pathway enrichment of down-regulated DEGs from GSE50760.
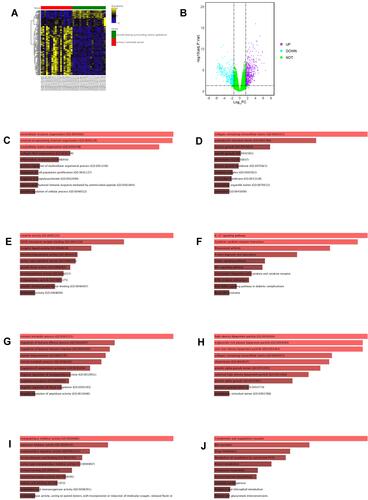
Figure 2 Analysis of DEGs from GSE104178. (A) Heatmap illustrates the top 200 DEGs in GSE104178 according to FDR p values. (B) Volcano plot illustrates the DEGs in GSE104178. (C) GO_Biological process enrichment of up-regulated DEGs from GSE104178. (D) GO_Cellular component enrichment of up-regulated DEGs from GSE104178. (E) GO_Molecular function enrichment of up-regulated DEGS from GSE104178. (F) KEGG pathway enrichment of up-regulated DEGs from GSE104178. (G) GO_Biological process enrichment of down-regulated DEGs from GSE104178. (H) GO_Cellular omponent enrichment of down-regulated DEGs from GSE104178. (I) GO_Molecular function enrichment of down-regulated DEGS from GSE104178. (J) KEGG pathway enrichment of down-regulated DEGs from GSE104178.
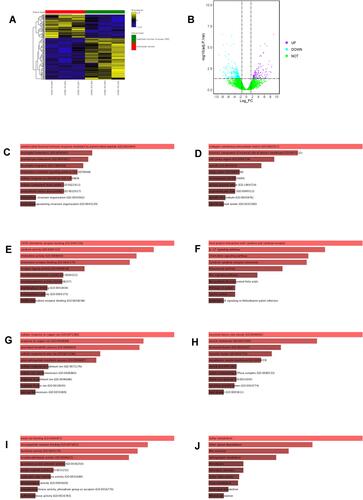
Figure 3 Functional enrichment of overlapped DEGs between GSE50760 and GSE104178. (A) Venn diagram illustrates the overlapped DEGs between GSE50760 and GSE104178. (B) GO_Biological process enrichment of overlapped DEGs between GSE50760 and GSE104178. (C) GO_Cellular component enrichment of overlapped DEGs between GSE50760 and GSE104178. (D) GO_Molecular function enrichment of overlapped DEGs between GSE50760 and GSE104178. (E) KEGG pathway enrichment of overlapped DEGs between GSE50760 and GSE104178.
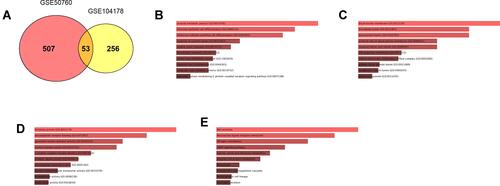
Figure 4 Construction of PPI network and miRNA-mRNA network. (A) PPI network construction of overlapped DEGs between GSE50760 and GSE104178. (B) The miRNA-mRNA network construction based on the miRNAs that target overlapped DEGs between GSE50760 and GSE104178. (C) PPI network construction according to Cytohubba tool, and a total of top 10 genes were identified in the network. (D) The miRNA-mRNA network construction based on the miRNAs that target 10 hub genes.
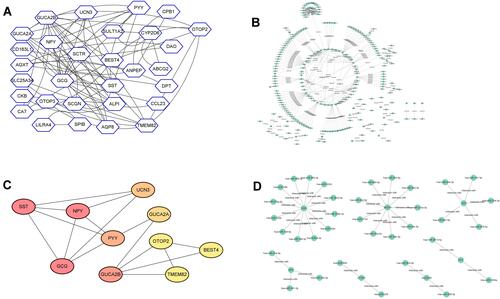
Figure 5 Kaplan–Meier survival analysis of patients with CRC. The association between the expression levels of GCG, SST, NPY, GUCA2B, PYY, UCN3, GUCA2A, TMEM82, BEST4 and OTOP2 and the overall survival of patients with CRC was analyzed using the KM-Plotter online tool. A total of 80 patients with CRC was included in the analysis.
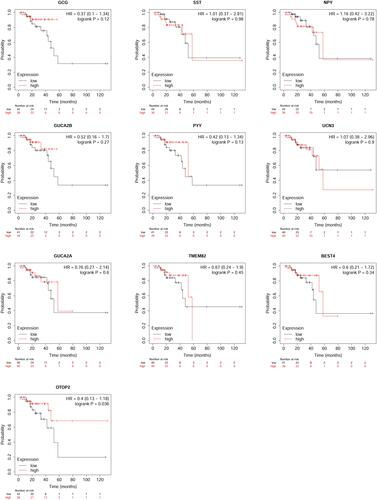
Figure 6 Expression analysis of OTOP2 in the CRC tissues. (A) The expression level of OTOP2 in the CRC tissues and normal tissues was examined by using GEPIA tool. (B) The expression level of OTOP2 in the CRC tissues and normal tissues was examined by using UACLAN tool. (C) The protein expression of OTOP2 in the CRC tissues and normal tissues was determined by the Human Protein Atlas tool. (D) The promoter methylation of OTOP2 in the CRC tissues and normal tissues was examined by using UACLAN tool. (E) The correlation between OTOP2 and other genes (top 50 genes) was analyzed using UACLAN tool. *P < 0.05.
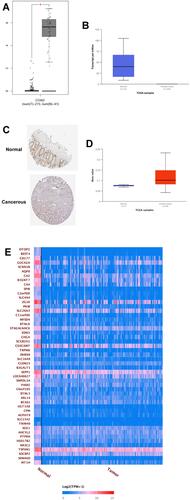
Figure 7 Effects of OTOP2 knockdown on the CRC cell migration, proliferation and EMT. HT29 and SW620 cells were transfected with si-NC, si-OTOP2#1 or si-OTOP2#2, and at 24 h after transfection, (A and B) the mRNA expression of OTOP2 in HT29 (A) and SW620 (B) cells was determined by qRT-PCR assay; (C and D) the caspase-3 activities of HT29 (C) and SW620 (D) cells were determined by the Caspase-3 activity assay kit; (E and F) the caspase-9 activities of HT29 (E) and SW620 (F) cells were determined by the Caspase-9 activity assay kit; (G and H) the migratory abilities of HT29 (G) and SW620 (H) cells were evaluated by wound healing assay; (I and J) the cell proliferation of HT29 (I) and SW620 (J) cells was determined by CCK-8 assay; (K and L) the mRNA expression levels of E-cadherin, N-cadherin, snail and vimentin in HT29 (I) and SW620 (J) cells were measured by qRT-PCR assay. N = 3; *P<0.05 and **P<0.01 compared to si-NC group.
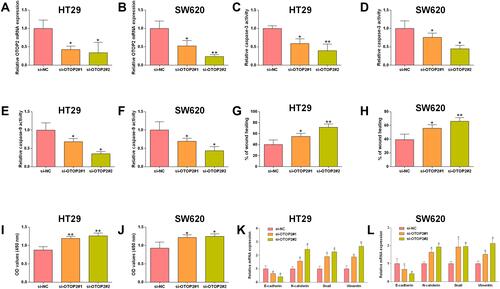
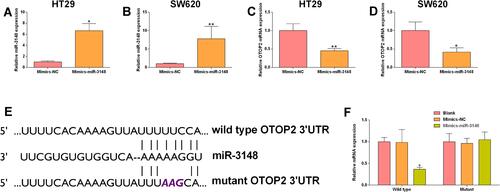
Figure 8 MiR-3148 inversely regulated OTOP2. HT29 and SW620 cells were transfected with Mimics-NC or miR-3148 mimics, and at 24 h after transfection, (A and B) the miR-3148 expression in HT29 (A) and SW620 (B) cells was determined by qRT-PCR assay; (C and D) the mRNA expression of OTOP2 in HT29 (E) and SW620 (F) cells was determined by qRT-PCR assay. (E) The predicted binding positions between miR-3146 and OTOP2 3’UTR. (F) The luciferase reporter activity of reporter vector containing OTOP2 3’UTR (wild type or mutant) in HEK293 cells after being transfected with Mimics-NC or miR-3148 mimics was determined by Dual-Luciferase reporter assay. N = 3, *P<0.05 and **P<0.01 compared to Mimics-NC group.