Figures & data
Table 1 Baseline Patients’ Characteristics in the Training Cohort (n = 98)
Table 2 Multiple Cox Proportional Hazard Regression in the Training Cohort (n = 98)
Table 3 Risk-Group Assignment Based on the Prognostic Score in the Training Cohort (n = 98)
Figure 1 Overall survival by risk groups in the training cohort (n=98). Kaplan–Meier curves of overall survival (OS) according to the Modena score in the training cohort. The prognostic score assigned patients to three risk groups with statistically different OS: low-risk (n=27; mOS 18 months), intermediate-risk (n=35; mOS 9.4 months) and high-risk (n=27; mOS 2.9 months) (p<0.001).
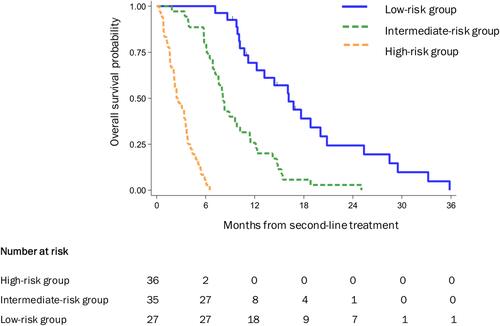
Figure 2 Nomogram for overall survival of biliary cancers treated with second-line chemotherapy. Using and interpreting the nomogram. Each variable incorporated in the Modena score has been listed separately together with the corresponding number of points reflecting its magnitude. For each variable, draw an upward vertical line to the “Points” bar to calculate points, then sum the points for each variable and locate this sum on the “Total Points” axis. Draw a downward vertical line from the “Total Points” line to calculate 6-month and 12-month overall survival probability.
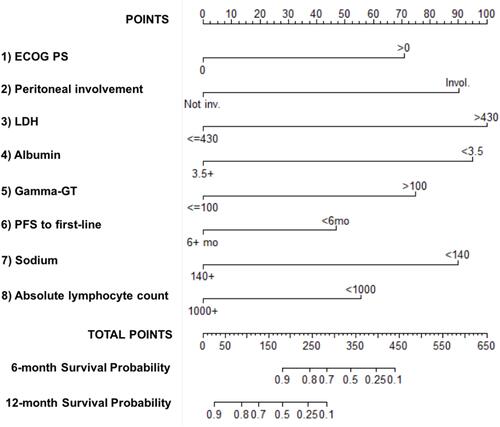
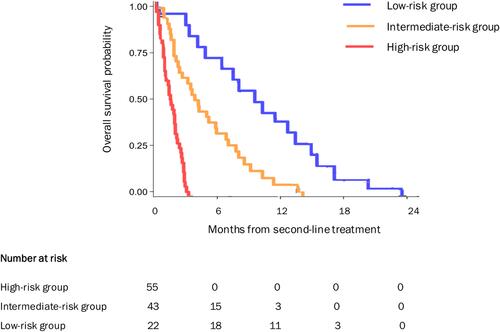
Figure 3 Overall survival by risk groups in the validation cohort (n=120). Kaplan–Meier curves of overall survival (OS) according to the Modena score in the validation cohort. The prognostic score assigned patients to three risk groups with statistically different OS: low-risk (n=22; mOS 12.8 months), intermediate-risk (n=43; mOS 6.4 months) and high-risk (n=55; mOS 2.5 months) (p<0.001).