Figures & data
Figure 1 The overview of the work.
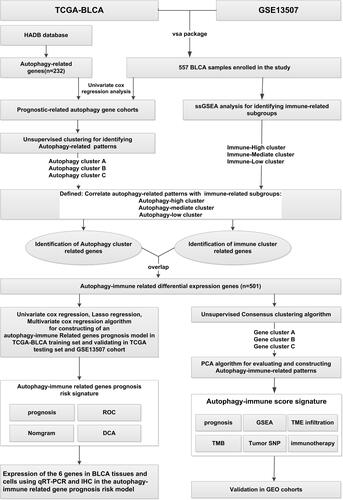
Figure 2 Hierarchical clustering of bladder cancer patients uncovered three immunophenotypes based on ssGSEA analysis. (A) The Kaplan–Meier survival curves of the three immunophenotypes (High, Mediate, Low) showed there were statistically insignificant differences among these three immune subtypes. (B) The heatmap showed the enrichment levels of 29 immune-associated infiltration cells in the three immune subtypes and immune infiltration characteristics obtained by ESTAMATE algorithm (including Stromal-Score, Immune-Score, Estimate-Score and Tumor-Purity). (C and D) The violin plot displayed the differences in Immune Score and Tumor Purity among the three immune clusters. (E–G) The boxplot showed the differential expression levels of immune checkpoint gene, including PD-L1 (E), PD-1 (F), CTLA4 (G) in the three immune subgroups, which showed that the expression of immune checkpoint genes in immune-High subgroup was significantly higher than the other subgroups. ***p < 0.001.
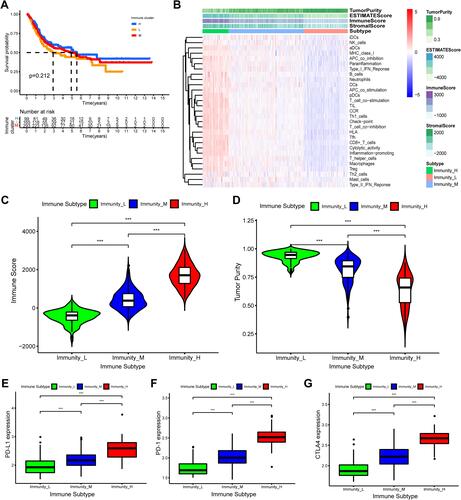
Figure 3 Differences in tumor microenvironment (TME) infiltration cell characteristics between autophagy clusters. (A)The boxplot showed the fraction of tumor immune infiltrating cells in the autophagy clusters. (B) The activities of anti-cancer immune response among the three autophagy clusters. (C and D) The violin plot displayed Immune Score and Tumor Purity among the three immune clusters were analyzed and visualized. (E–G) The violin plot showed the differential expressions of immune checkpoint gene, including PD-L1 (E), PD-1 (F), CTLA4 (G) in the three autophagy clusters, which showed that the expression of immune checkpoint genes in autophagy-High subgroup was significantly higher than the autophagy-Mediate and -low subgroups. *P<0.05, ***p < 0.001.
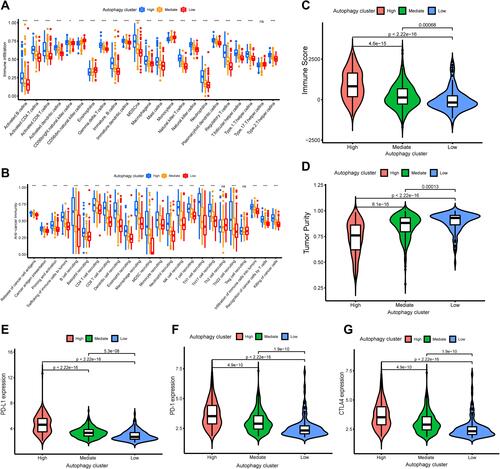
Figure 4 Construction and evaluation of differential expression of autophagy immune gene signatures. (A) The Venn diagrams showed 535 autophagy-immune related differentially expressed genes (DEGs) were overlapped from autophagy-related DEGs and immune-related DEGs. (B) The autophagy-immune related genes were utilized to construct gene cluster and then the K-M survival curves of the gene cluster were performed, which showed there were statistically significant differences among these three gene subtypes. (C) The boxplot was performed to visualize the expression levels of 43 prognostic-related gene among different gene clusters in merger dataset. (*p < 0.05; **p < 0.01; ***p < 0.001) (D–F) The violin plot showed the differential expressions of immune checkpoint gene, including PD-L1 (D), PD-1 (E), CTLA4 (F) in the three gene clusters, which showed that the expression of immune checkpoint genes in gene cluster B subgroup was significantly higher than the other subgroups. (G) Comparison of Autophagy-Immune (AI) score across gene clusters showed no significant differences between the three clusters. (H) Comparison of AI score across autophagy clusters showed autophagy-High cluster with the lowest AI score.
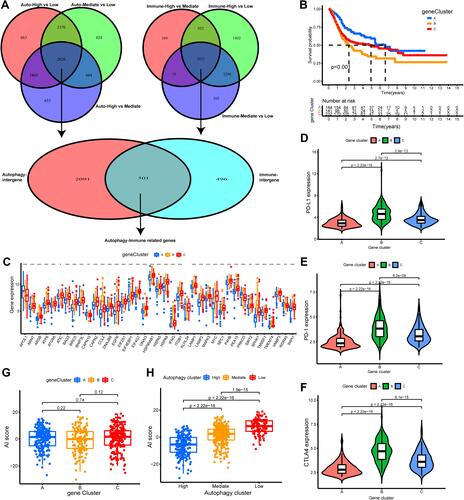
Figure 5 Construction and validation of autophagy-immune score (AI-score) for bladder cancer patients. (A and B) The boxplot showed the fraction of tumor immune infiltrating cells in high- and low AI-score subgroup in the autophagy clusters in training set (A) and testing set (B). (C and D) Kaplan–Meier survival curves showed that the Low AI-score subgroup had worse overall survival (OS) than the high AI-score subgroup in training set (C) and testing set (D). (E) Spearman analysis showed the correlation between AI-score and tumor immune infiltrating cells. Red represented positive correlation and blue represented negative correlation. (F) Sankey diagram showed the relationship among autophagy clusters, gene cluster, AI-score and survival status (Alive or Dead). (G) The proportion of bladder cancer patients with survival status in high and low AI-score subgroup. (H) The boxplot showed remarkable differences in AI-score across survival status. ***p < 0.001.
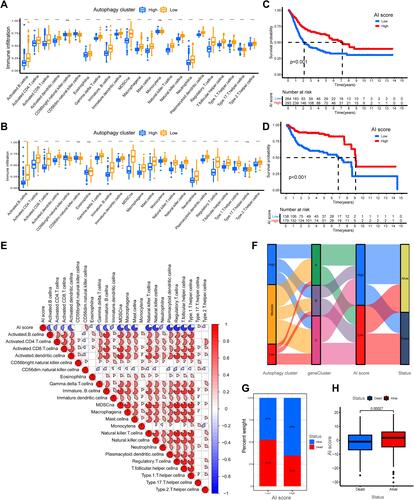
Figure 6 Characteristics of autophagy-immune score (AI-score) in autophagy subtypes and tumor somatic mutation. (A) Kaplan–Meier curves showed that high tumor mutation burden (H-TMB) subgroup had better survival probability than Low-TMB (L-TMB) subgroup in the training set. (B) Survival analysis of H-TMB (137 cases) and L-TMB (255 cases) subgroup stratified by high and low AI-score using Kaplan–Meier curves (P < 0.001, Log rank test). (C and D) Waterfall charts of tumor somatic mutations were established with high AI scores (C) and low AI scores (D). Each column indicates an individual sample. (E and F) Kaplan–Meier survival curves showed the survival outcomes of high- and low-AI-score in bladder cancer patients stratified by AJCC T stage (T2-4 vs Ta-1), respectively. (G and H) Gene set enrichment analysis (GSEA) showed the top 5 KEGG signaling pathways in high AI-score bladder cancer patients (G) and low AI-score bladder cancer patients (H).
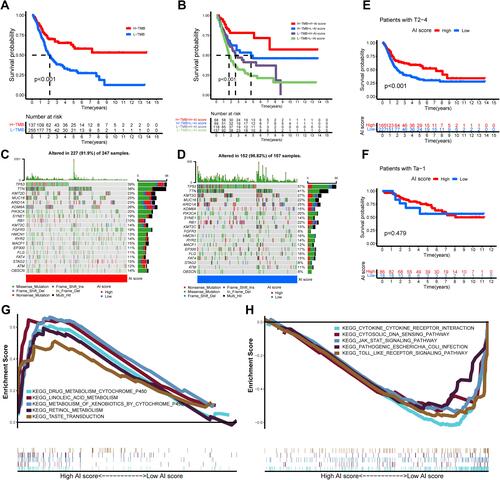
Figure 7 The role of AI-score based on autophagy clusters in predicting immunotherapeutic benefits and immune response. (A–D) Comparison of the clinical benefit of targeting CTLA4(-) + PD-1(-) (A), CTLA4(-) + PD-1(+) (B), CTLA4(+) + PD-1(-) (C), CTLA4(+) + PD-1(+) (D) on immunotherapy in high or low AI-score subgroups. (E) The percent weight of clinical response (CR/PR and PD) to anti-PD-1 immunotherapy in high or low AI-score subgroups in the GSE78220 cohort. (F) Distribution of AI-score in different anti-PD-1 clinical response status (CR/PR/PD) to immunotherapy in the GSE78220 cohort. (G) The boxplot illustrated no significant difference in AI-score among different anti-PD-1 clinical response groups in the GSE78220 cohort. (H) Kaplan–Meier curves showed high AI-score subgroup had better survival probability than low AI-score subgroup in GSE78220 cohort (Log rank test, p = 0.009). (I) The percent weight of clinical response (CR/PR and SD/PD) to anti-PD-L1 immunotherapy in high or low AI-score subgroups in the IMvigor210 cohort. (J) Distribution of AI-score in different anti-PD-L1 clinical response status (CR/PR/SD/PD) to immunotherapy in the IMvigor210 cohort. (K) The boxplot illustrated significant differences in AI-score among different anti-PD-L1 clinical response groups in the IMvigor210 cohort. (L) Kaplan–Meier curves showed high AI-score subgroup had better survival probability than low AI-score subgroup in IMvigor210 cohort (Log rank test, p = 0.044).
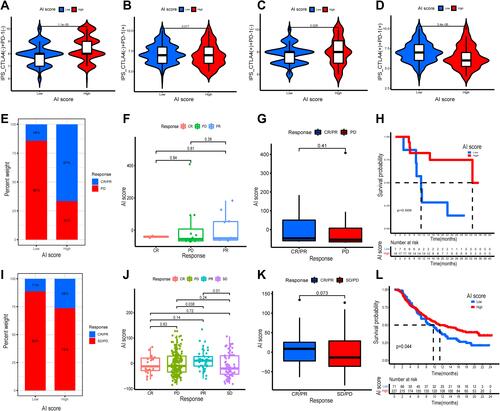
Table 1 Comparison of Clinical Characteristics of BLCA* Patients in Training Set, Testing Set and Overall Set
Table 2 Univariate and Multivariate Cox Regression Showed Age, Stage, Risk Score Were Independent Prognostic Factors (P<0.05)
Figure 8 Construction and evaluation of an autophagy-immune-related genes prognosis model. (A) The least absolute shrinkage and selection operator (LASSO) Cox regression analysis was applied to calculate Lasso coefficient values and vertical dashed lines at the best log (lambda) value in the training set. Lasso coefficient profiles of the prognosis-related genes were demonstrated. (B) Receiver operating characteristic (ROC) curves for the prognosis signature and their AUC value were represented 1-, 3-, and 5-year predictions in training set. (C) Kaplan–Meier survival curves displayed that the high-risk subgroup had worse overall survival (OS) than the low-risk subgroup in training set (p<0.001). (D and E) ROC curves and Kaplan–Meier survival curves were used to validate the prognosis signature in overall set, testing set and GSE13507 dataset. (F and G) The DCA curve and multivariate ROC curve were performed to evaluate predictive accuracy of risk score and nomogram. The results showed that the predictive accuracy risk score and nomogram were higher than other clinicopathological features including age, gender, grade, stage. (H) Prognosis-related nomogram was constructed based on risk score in the model and prognosis-associated clinicopathological parameters including age, gender, stage, grade, AJCC T, N, and M, to predict 1-, 3-, and 5-year OS of BLCA patients. (I and J) ROC curves and calibration curves of the nomogram displayed the concordance between predicted and observed 1-, 3- and 5-year OS.
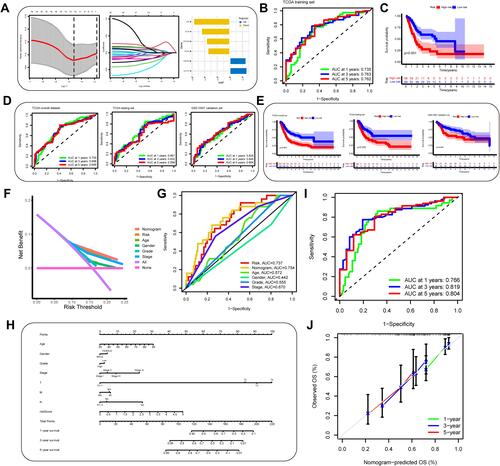
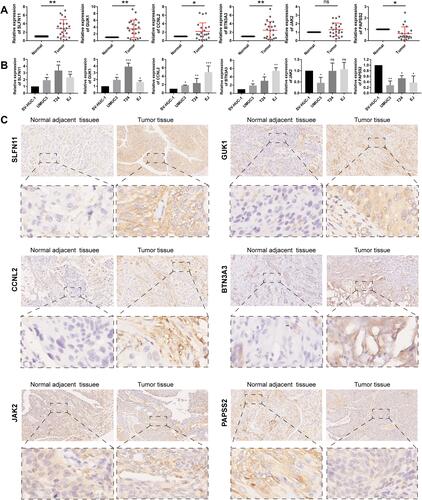
Figure 9 (A)Relative expression levels of the 6 autophagy-immune-related genes in the prognosis model in 22 paired BLCA and matched adjacent normal bladder tissues were examined by qRT-PCR. (B) Relative expression levels of 6 autophagy-immune-related genes in the prognosis model in normal bladder cell (SV-HUC-1) and bladder cancer cells (UMUC3, T24, EJ). (C) Representative images of immunohistochemistry of 6 autophagy-immune-related genes in BLCA tissues compared to adjacent normal bladder tissues. *p < 0.05; **p < 0.01; ***p < 0.001.