
Figures & data
Figure 1 Ultrasound image of the thoracic paravertebral block. The red arrow denotes the puncture path of the needle. Compared with the picture above, the pleura in the picture below is being pressed down by the local anaesthetics.
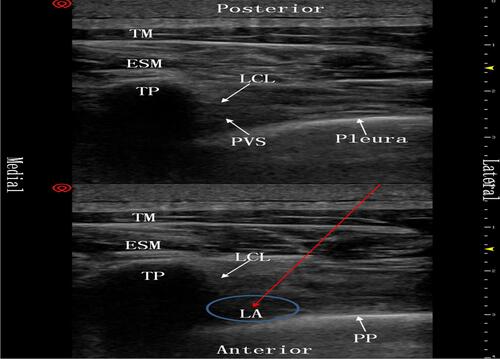
Figure 2 Flow diagram of the study.
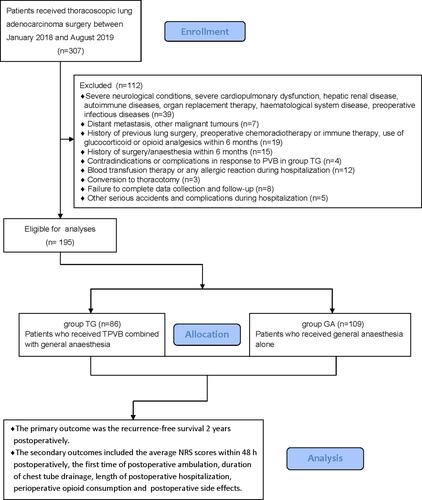
Figure 3 Comparison of Kaplan–Meier survival curves for the 2-year postoperative recurrence-free survival between groups. There were no statistical differences in the 2-year postoperative recurrence-free survival between groups (multivariate hazard ratio 0.706, 95% CI 0.126–3.941, P=0.691).
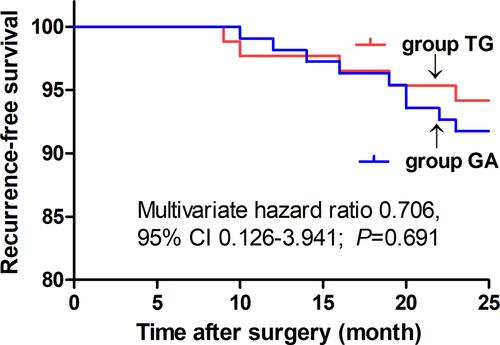
Figure 4 Comparison of the average pain scores 48 h postoperatively between groups. The data are given as mean ± SD, compared with group GA, *P<0.05. Data were compared by independent-sample t-test.
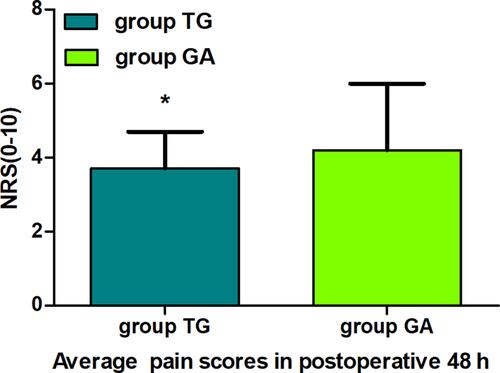
Figure 5 Comparison of postoperative early recovery between groups. The first time of postoperative ambulation (A), the duration of chest tube drainage (B), the length of postoperative hospitalization (C). The data are given as mean ± SD, compared with group GA, *P<0.05. Data were compared by independent-sample t-test.
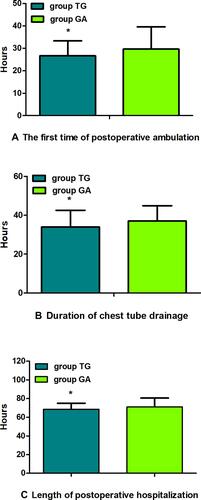
Figure 6 Comparison of intraoperative and postoperative sufentanil dosage between groups. The data are given as mean ± SD, compared with group GA, *P<0.01. Data were compared by independent-sample t-test.
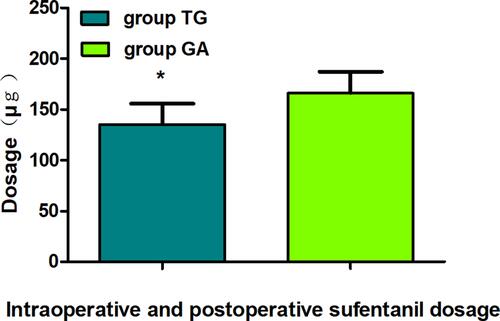
Table 1 Comparison of Demographic Data and Characteristics in the Two Groups
Table 2 Cox Regression Analysis for Recurrence-Free Survival at Postoperative Year 2
Table 3 Comparison of Side Effects After Operation (n (%))