Figures & data
Figure 1 Effects of different concentrations of paclitaxel on cell viability of MCF-7 (A) and MDA-MB-231 (B). Data are expressed as the mean ±SD. n=3 for each group. *p<0.05, **p<0.01, ***p<0.001 compared with the control group.
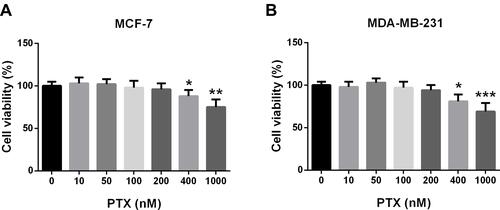
Figure 2 Cell viability of MCF-7 (A) and MDA-MB-231 (B) with the treatment of 400 nM paclitaxel and HIFU. Data are expressed as the mean ±SD. n=3 for each group. *p<0.05, **p<0.01 compared with the control group; #p<0.05, ##p<0.01 compared with the control + PTX group.
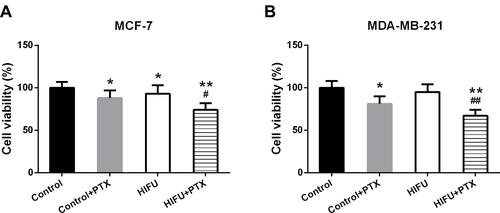
Figure 3 Levels of CAT (A and D), MDA (B and E) and SOD (C and F) in MCF-7 and MDA-MB-231 induced by paclitaxel were detected. Data are expressed as the mean ±SD. n=3 for each group. *p<0.05, **p<0.01, ***p<0.001 compared with the control group; #p<0.05 compared with the control + PTX group.
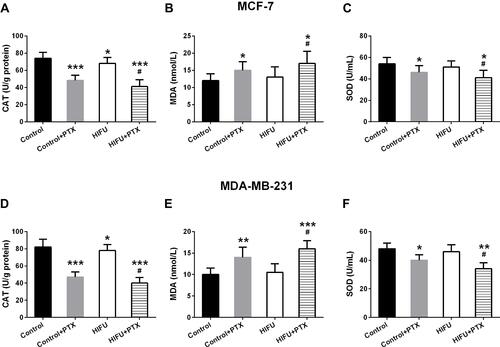
Figure 4 Cell apoptosis of MCF-7 and MDA-MB-231 induced by paclitaxel were enhanced by HIFU. (A) Representative images and the percentages of cell apoptosis in MCF-7 (B) and MDA-MB-231 cells (C). Data are expressed as the mean ±SD. n=3 for each group. *p<0.05, **p<0.01, ***p<0.001 compared with the control group; #p<0.05, ##p<0.01 compared with the control + PTX group.
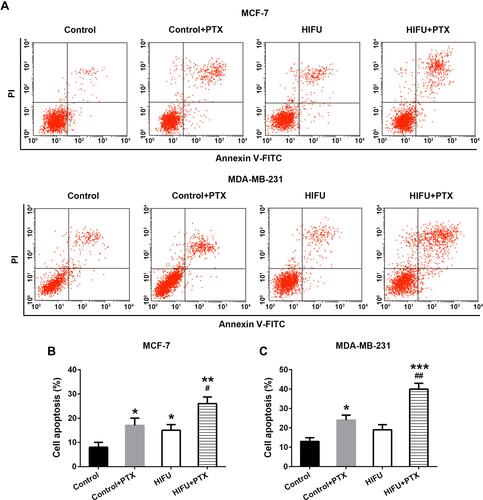
Figure 5 Antitumor efficacy using HIFU and PTX. Tumor volume (A), body weight (B) and survival probability (C) in different groups were monitored. Data are expressed as the mean ±SD. n=5 for each group. *p<0.05, **p<0.01 compared with the saline group; # p<0.05 compared with the PTX group.
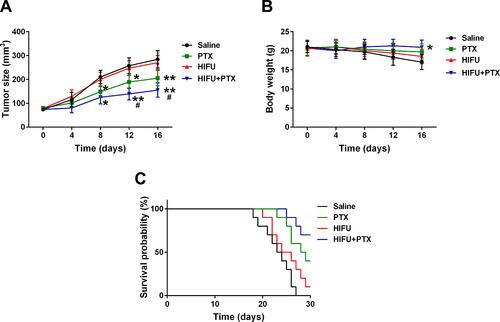
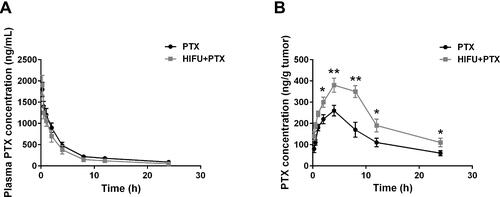
Figure 6 Pharmacokinetics of PTX after injection of PTX in different groups. PTX concentration in plasma (A) and tumors (B). Data are expressed as the mean ±SD. n=5 for each group. *p<0.05, **p<0.01 compared with the PTX group.