Figures & data
Table 1 Baseline Characteristics
Figure 1 Next generation sequencing heat map of 48 patients.
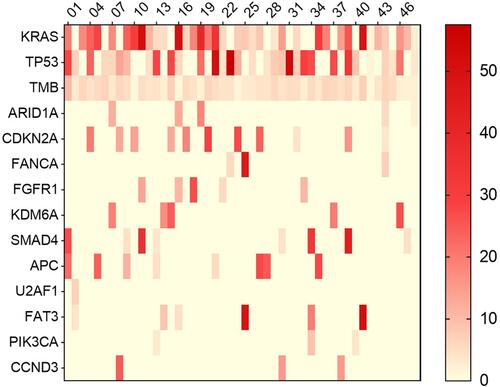
Table 2 KRAS/TP53 Co-Mutation Patients (N = 20)
Figure 2 Comparison of efficacy between the two groups. (A) Efficacy evaluation results of AG group; (B) Efficacy evaluation results of PD-1+AG group.
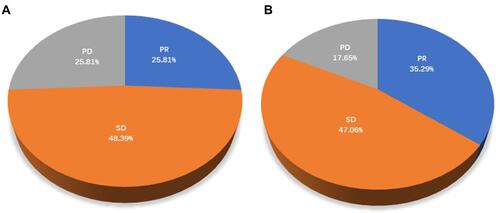
Figure 3 (A) Kaplan–Meier PFS curves of patients treated with PD-1 +AG versus AG (P=0.154); (B) Kaplan–Meier OS curves of patients treated with PD-1+AG versus AG (P<0.001).
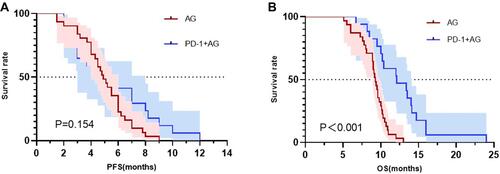
Figure 4 (A) Forest plot for univariate analysis. (B) Forest plot of multivariate analysis.
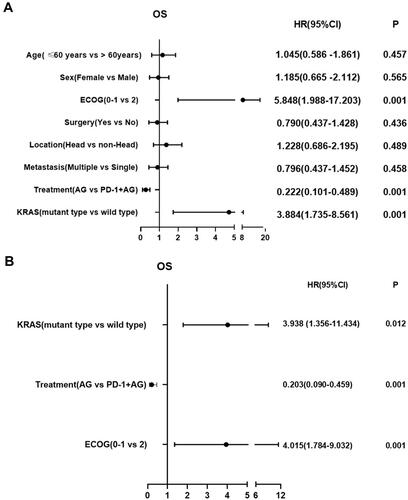
Table 3 Comparison of Grade 1–2 Adverse Events
Table 4 Comparison of Grade 3–4 Adverse Events
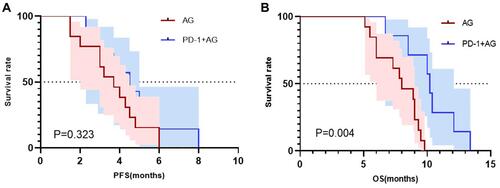
Figure 5 (A) Kaplan–Meier PFS curves of patients with KRAS and TP53 co-mutations (P=0.323); (B) Kaplan–Meier OS curves of patients with KRAS and TP53 co-mutations (P=0.004).