Figures & data
Table 1 Clinicopathological Characteristics of the 18 SCLC Patients
Figure 1 Mutation landscape of SCLC. (A) Genomic alteration profiling. X axis is specific specimens and Y axis is the detected mutations for a different gene. The percentage of mutation of a specific gene in total patients. (B) Distribution of mutations in SCLC.
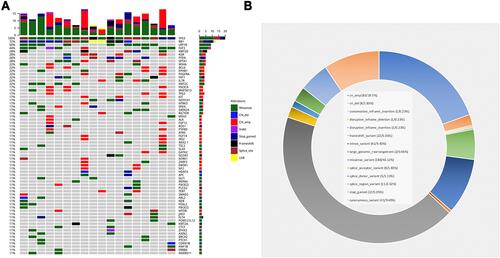
Figure 2 (A) Genetic alteration in our cohort consistent with Burning Rock Biotech SCLC database (RS_SCLC). (B) Genetic differences between SCLC and non-small cell lung cancer (NSCLC) (C). Single nucleotide variation analysis. *in (B and C) represents statistically significant differences (p < 0.05). **in (B and C) represents statistically significant differences (0.01<p < 0.05). *** in (B and C) represents statistically significant differences (p < 0.01). **** in (B and C) represents statistically significant differences (p < 0.001).
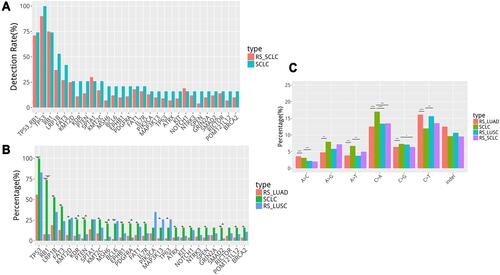
Figure 3 Gene copy number variation (CNV) (A) and tumor mutation burden (TMB) (B) in our SCLC cohort differ from lung adenocarcinoma.
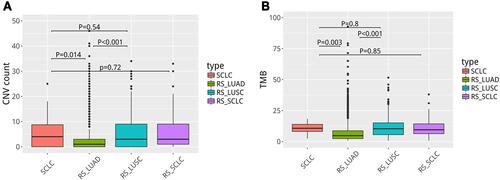
Figure 4 The correlation between mutant gene and clinicopathological data including gender, smoking, specimen origins, metastasis site, and progression free survival and overall survival. Red indicates statistically significant differences (p < 0.05).
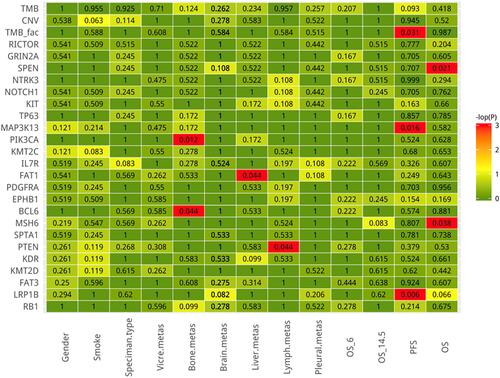
Figure 5 Kaplan–Meier curve indicated that SCLC patients with LRP1B (A) or MAP3K13 (B) mutation had significantly shorter PFS. SCLC patients with MSH6 mutation had significantly longer OS (C) while OS was significantly shorter in patients with SPEN mutation (D).
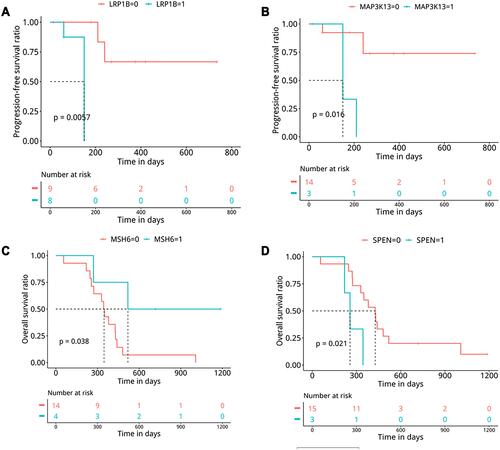
Figure 6 The proportion of mutant-PIK3CA is higher in patients with bone metastases (A), the proportion of mutant-FAT1 is higher in patients with liver metastases (B).
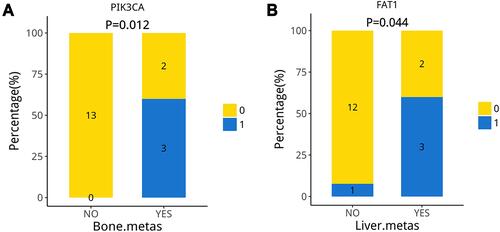
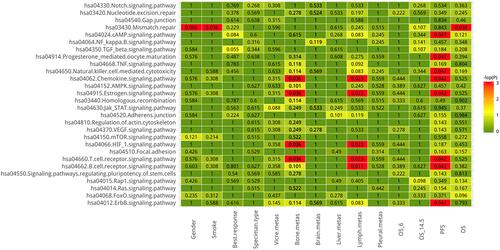
Table 2 The Clinical Factors are Associated with Signaling Pathway Based on KEGG Pathway to Some Extent
Figure 7 The correlation between signaling pathways involved in mutant genes (based on KEGG pathway) and clinicopathological data including gender, smoking, specimen origins, metastasis site, and progression free survival and overall survival. Red indicates statistically significant differences (p < 0.05).