Figures & data
Figure 1 Platinum agents (cisplatin, nedaplatin, and carboplatin).
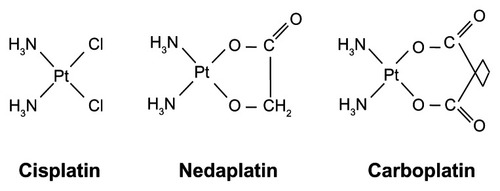
Figure 2 Postulated pathway for hydrolysis and DNA binding of nedaplatin.
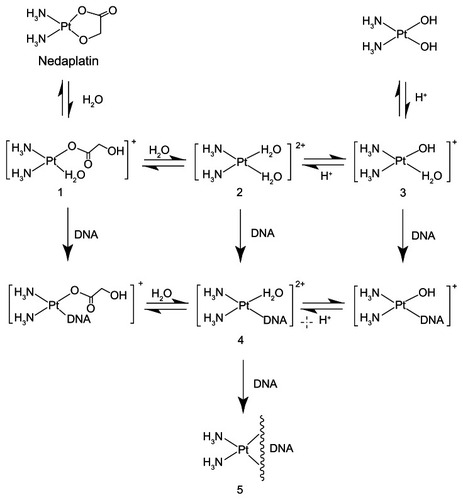
Figure 3 Observed AUC and dose of nedaplatin (mg/m2).
Abbreviation: AUC, area under the curve.
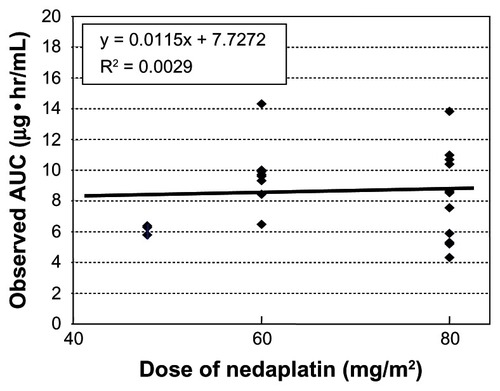
Figure 4 Observed AUC and clearance.
Note: There was favorable correlation between observed AUC and dose normalized by creatinine clearance.
Abbreviation: AUC, area under the curve.
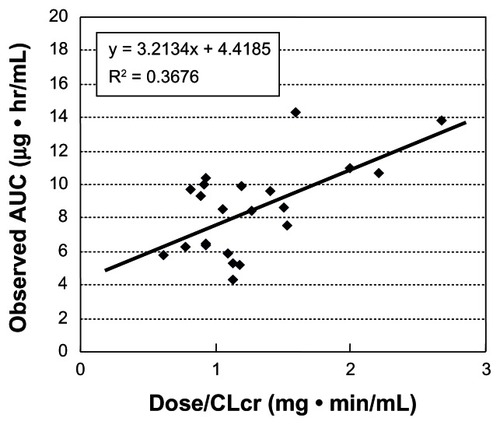
Figure 5 Predictive AUC and observed AUC.
Note: Predictive AUC was correlated with the observed AUC.
Abbreviations: AUC, area under the curve; ME, mean prediction error as a measure of bias; RMSE, root mean squared error as a measure of precision.
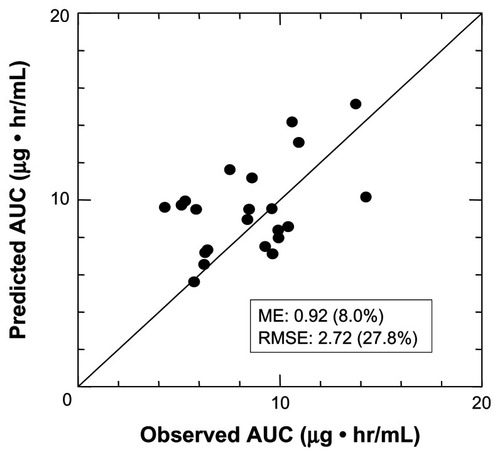
Figure 6 Observed AUC and relative reduction rate of platelet.
Notes: There was a relationship between the observed AUC and rate of decrease in platelets (PLT). Five patients, who were circled in figure, underwent concurrent chemoradiotherapy and showed unexpectedly grade 4 thrombocytopenia, and the predicted PLT did not follow the regression line.
Abbreviations: PLTnadir, the nadir of platelets count after nedaplatin administration; PLTpre, the platelets count before nedaplatin administration; AUC, area under the curve; SD, standard deviation.
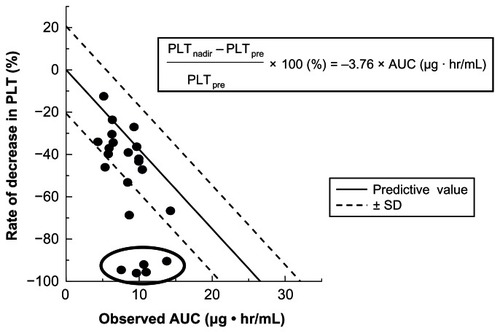
Table 1 Phase II studies of nedaplatin