228
Views
5
CrossRef citations to date
0
Altmetric
Original Research

Recurrence-Free Survival Outcomes Based on Novel Classification Combining Lymphovascular Invasion, Perineural Invasion, and T4 Status in Stage II–III Colon Cancer

ORCID Icon, , , , ORCID Icon & ORCID Icon
Pages 2031-2040 | Published online: 20 Jun 2022

Figures & data

Table 1 Patient Characteristics (n = 1247)

Table 2 Comparison of Clinicopathologic Features According to the Risk Grouping

Figure 1 Comparison of 5-year recurrence-free survival according to the risk grouping and TNM stage in patients with stage II–III (A) no-risk group, 78.5%; low-risk group, 65.5%; high-risk group, 58.7%, P < 0.001), in patients with stage II (B) no-risk group, 82.54%; low-risk group, 76.2%; high-risk group, 55.5%; P < 0.001), in patients with stage III (C) no-risk group, 76.0%; low-risk group, 59.9%; high-risk group, 57.0%; P < 0.001).

Figure 1 Comparison of 5-year recurrence-free survival according to the risk grouping and TNM stage in patients with stage II–III (A) no-risk group, 78.5%; low-risk group, 65.5%; high-risk group, 58.7%, P < 0.001), in patients with stage II (B) no-risk group, 82.54%; low-risk group, 76.2%; high-risk group, 55.5%; P < 0.001), in patients with stage III (C) no-risk group, 76.0%; low-risk group, 59.9%; high-risk group, 57.0%; P < 0.001).

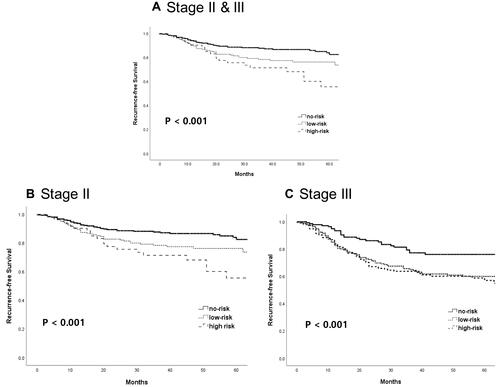
Table 3 Univariate and Multivariate Analysis of Recurrence-Free Survival

Figure 2 Comparison of 5-year recurrence-free survival in patients with stage II according to the presence of risk factors and chemotherapy (A) stage II: 75% (chemotherapy (-)) vs 79.4% (chemotherapy (+)); P = 0.338), (B) stage II with no risk factor: 80.5% (chemotherapy (-)) vs 86.3% (chemotherapy (+)); P = 0.232), (C) stage II with one or more risk factors; 59.5% chemotherapy (-) vs 75.2% (chemotherapy (+)); P < 0.001).

Figure 2 Comparison of 5-year recurrence-free survival in patients with stage II according to the presence of risk factors and chemotherapy (A) stage II: 75% (chemotherapy (-)) vs 79.4% (chemotherapy (+)); P = 0.338), (B) stage II with no risk factor: 80.5% (chemotherapy (-)) vs 86.3% (chemotherapy (+)); P = 0.232), (C) stage II with one or more risk factors; 59.5% chemotherapy (-) vs 75.2% (chemotherapy (+)); P < 0.001).

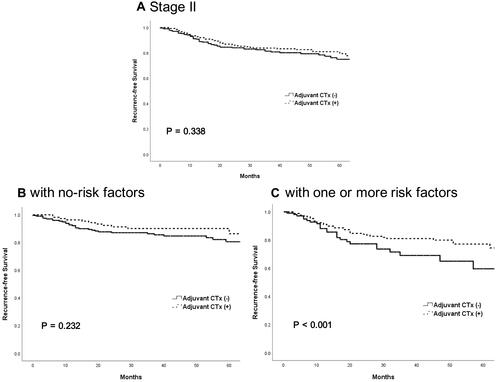
Table 4 Univariate and Multivariate Analysis of Predicting Factor for the High Risk Group