Figures & data
Figure 1 The transcriptional level of CSTF2 in HCC. (A) CSTF2 transcriptional levels in various cancers analyzed in the TIMER database. (B–F) The expression of CSTF2 in HCC based on TCGA database (B), GSE45436 (C), GSE84402 (D), GSE105130 (E), and ICGC database (F). (G) Elevated mRNA levels of CSTF2 in the hepatocellular carcinoma cell line HepG2.
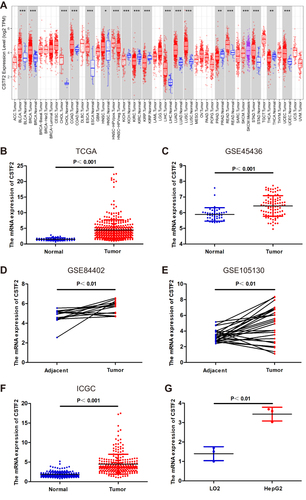
Figure 2 CSTF2 protein was upregulated in HCC. (A) The protein expression of CSTF2 in HCC based on the HPA database. (B) The protein expression of CSTF2 in cell lines.
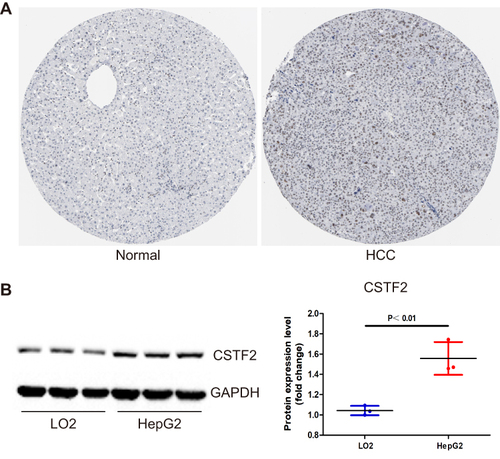
Table 1 Relationship Between CSTF2 and Clinicopathological Characteristics of HCC Patients
Table 2 Univariate and Multivariate Cox Regression Analyses Were Conducted to Identify Independent Risk Factors for Poor Survival of HCC
Figure 3 Diagnostic and prognostic values of CSTF2 in HCC based on TCGA database. (A) The diagnostic capability of CSTF2 was evaluated in the TCGA-LIHC cohort. (B) The relationship of CSTF2 expression and overall survival was evaluated in GEPIA with TCGA data.
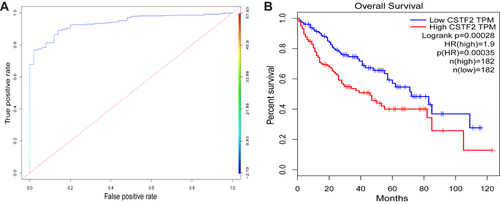
Figure 4 Establishment and validation of a prediction nomogram in TCGA and ICGC cohorts. (A) The CSTF2-based nomogram for predicting 1-, 3-, and 5-year overall survival rates of HCC patients in the TCGA-LIHC cohort. (B) Calibration curves of 1-, 3-, and 5-year overall survival for HCC patients in the TCGA-LIHC cohort. (C) Calibration curves of 1- and 3-year overall survival for HCC patients in the ICGC cohort.
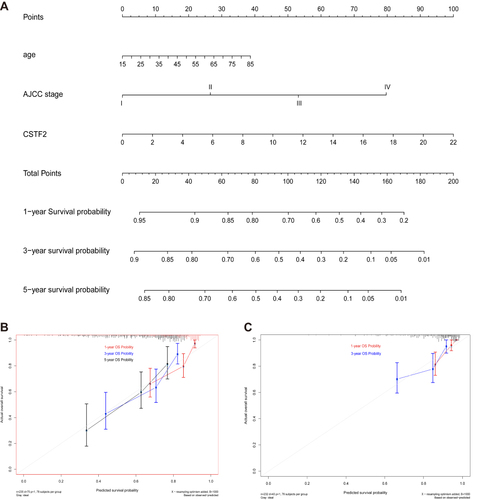
Figure 5 Diagnostic and prognostic values of CSTF2 in HCC based on the ICGC database. (A) The diagnostic capability of CSTF2 was validated in the ICGC cohort. (B) The relationship of CSTF2 expression and overall survival was validated in the ICGC cohort. (C and D) The independent risk factors were identified in the ICGC cohort by univariate (C) and multivariate (D) Cox regression analyses.
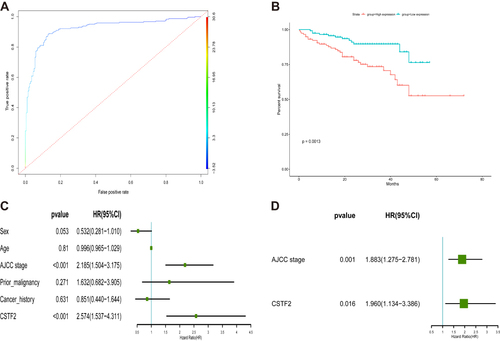
Figure 6 Functional enrichment analyses of CSTF2-related genes in HCC. (A) The top 50 positively correlated genes of CSTF2 are displayed by a heatmap. (B) The top 50 negatively correlated genes of CSTF2 are displayed by a heatmap. (C) GO enrichment analysis of the top 50 positively correlated genes of CSTF2. (D) KEGG enrichment analysis of the top 50 positively correlated genes of CSTF2.
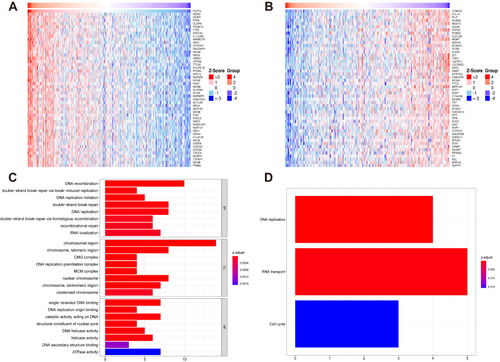
Table 3 Correlation Analysis of CSTF2 with Immune Cell Markers in the TIMER Database
Figure 7 Relationship between CSTF2 expression and immune cell infiltration. (A) The distribution of 22 immune cell subpopulations between the CSTF2 high (red) and low (blue) expression groups. (B) The correlation of CSTF2 expression with immune cells was analyzed in the TIMER database. (C–G) CSTF2 expression was positively correlated with the immune checkpoints PD-L1 (C), CTLA4 (D), TIM3 (E), PD-1 (F) and TIGIT (G). (H) The expression of immune checkpoints between the CSTF2 high (red) and low (blue) expression groups.
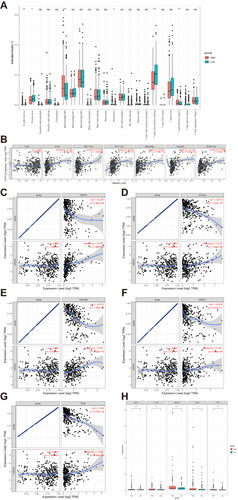
Figure 8 CSTF2 silencing alleviated the malignant phenotypes in hepatic cancer cells. (A) The mRNA expression of CSTF2 in HepG2 cells was significantly inhibited by si-CSTF2#3 transfection. (B) CSTF2 protein in HepG2 cells was significantly inhibited by si-CSTF2#3 transfection. (C) CSTF2 silencing inhibited the proliferation of HepG2 cells. (D) The protein expression of Bcl-2 (anti-apoptotic protein) and Bax (pro-apoptotic protein) in transfected HepG2 cells. (E) CSTF2 silencing increased the apoptosis of HepG2 cells. (F) CSTF2 silencing reduced the migration and invasion of HepG2 cells.
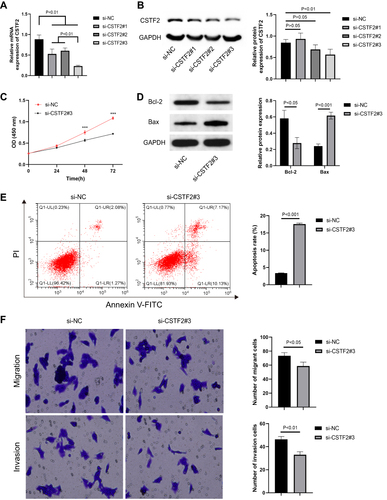
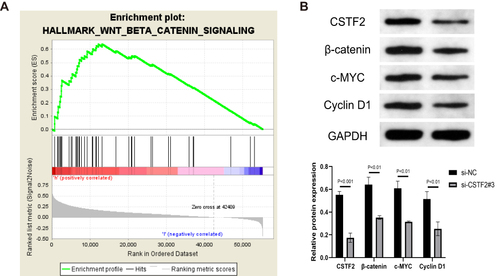
Figure 9 CSTF2 silencing inactivated the Wnt/β-catenin signaling pathway. (A) GSEA revealed that the Wnt/β-catenin signaling pathway was enriched in CSTF2 high expression group based on TCGA-LIHC cohort. (B) CSTF2 and Wnt/β-catenin signaling pathway-related protein expression in transfected HepG2 cells.