Figures & data
Table 1 Patient Characteristics at Baseline
Table 2 Association Between Response and Clinical Prognostic Indices
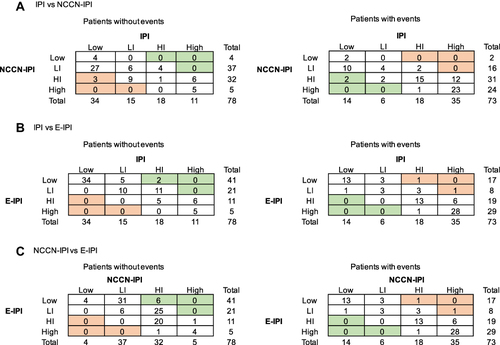
Figure 1 Overall survival (OS) based on risk stratification by three clinical risk scoring indices. The OS for 158 patients treated with the R-CODP regimen was classed with the International Prognostic Index (IPI) in (A), the National Comprehensive Cancer Network-IPI (NCCN-IPI) in (B), and the elderly IPI (E-IPI) in (C). The OS curve for the entire study population is presented in (D).
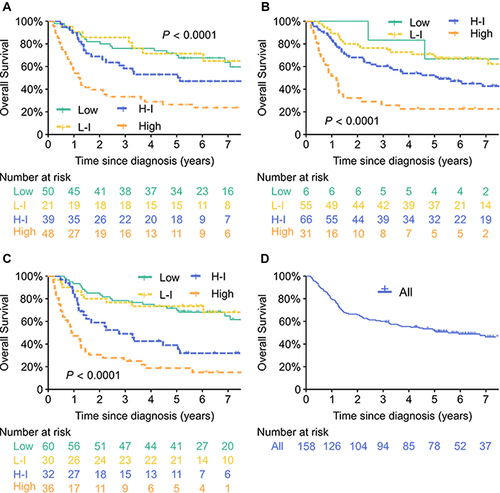
Table 3 Stratification Models for OS
Table 4 AUC for Predicting Mortality
Figure 2 Comparison of ROC curves for 5-year mortality. Pairwise comparisons for ROC curves were evaluated by DeLong et al, 1988. IPI vs NCCN-IPI: P = 0.786; IPI vs E-IPI: P = 0.036; NCCN-IPI vs E-IPI: P = 0.183.
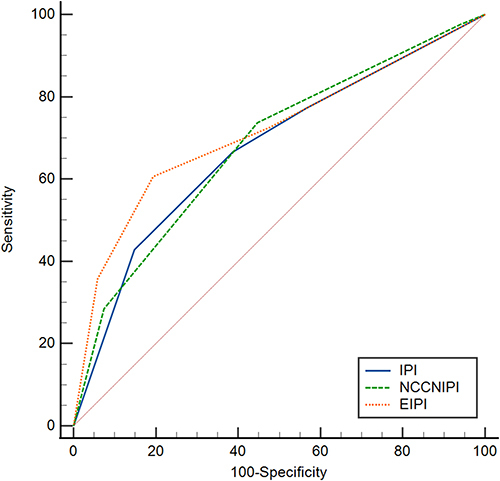
Figure 3 Reclassification tables for 5-year mortality. Green cells represent correct reclassification by the model on the right of the table, and the orange cells show incorrect reclassification by the model above the table. Patients who were lost to follow-up before the 5 years were censored. The risk classification for patients without events (controls) and with events (died within 5 years) are shown in (A) (IPI vs NCCN-IPI), (B) (IPI vs E-IPI), and (C) (NCCN-IPI vs E-IPI). For example, among patients with events, all patients were assessed as high-intermediate (HI) or high-risk group by E-IPI and IPI (B). However, for patients without events, 2 patients were categorized into low- or low-intermediate (LI) risk groups using E-IPI but high- or high-intermediate (HI) risk groups with IPI.