Figures & data
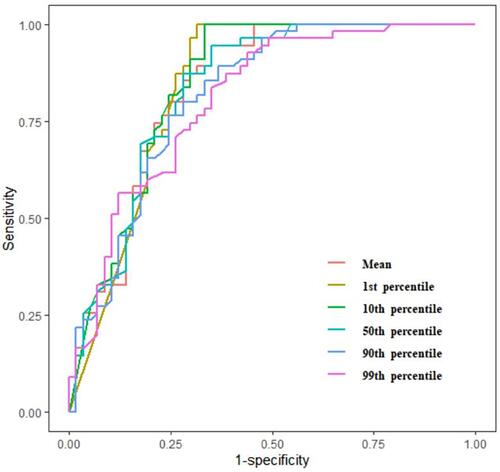
Figure 1 Flowchart of the patient selection process in current study.
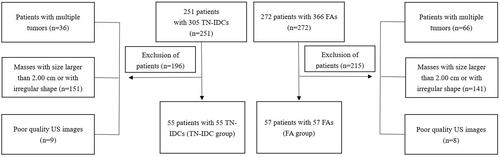
Figure 2 A 69-year-old woman with TN-IDC in the left breast. (A) and (B) An ROI for the oval hypoechoic mass in the grey-scale US image. (C) Grey-scale histogram of the tumor. The values of grey-scale histogram parameters are as follows: mean, 52.86; variance, 330.42; skewness, 0.48255; and kurtosis, 0.81965; 1st percentile, 13; 10th percentile, 31; 50th percentile, 52; 90th percentile, 76; and 99th percentile, 106. (D) HE staining showed obvious tumor cell atypia with hemorrhage and necrosis, vacuolar nuclear chromatin, obvious nucleolus, fibrous connective tissue reaction and inflammatory cell infiltration (HE×100). (E) Negative expression of ER in the tumor cells (IHC×100). (F) Negative expression of PR in the tumor cells (IHC × 100). (G) Negative expression of HER-2 in the tumor cells (IHC×100).
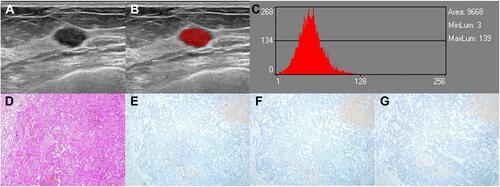
Figure 3 A 47-year-old woman with FA in the right breast. (A and B) An ROI for the oval hypoechoic mass in the grey-scale US image. (C) Grey-scale histogram of the tumor. The values of grey-scale histogram parameters are as follows: mean, 96.701; variance, 580.27; skewness, 0.40754; and kurtosis, 0.59665; 1st percentile, 46; 10th percentile, 67; 50th percentile, 96; 90th percentile, 126; and 99th percentile, 164. (D) Microscopically, spindle cells in the stroma are nodular hyperplasia with mucus degeneration, and the compressed duct is fissure (HE×100).
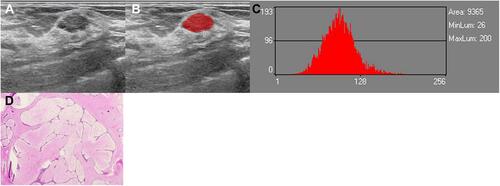
Table 1 Clinicopathologic Characteristics of 57 FAs and 55 TN-IDCs
Table 2 Interreader ICC Values for the Measurements of Histogram Parameters Between Two Readers
Table 3 Comparison of Histogram Parameters Between FA Group and TN-IDC Group
Table 4 ROC Analysis of Mean, Nth Percentiles for Distinguishing TN-IDC from FA
Figure 4 Receiver operating characteristic curves for mean, nth percentiles in distinguishing TN-IDC from FA.