
Figures & data
Table 1 Baseline Clinical Characteristics of Patients
Table 2 Multivariate Cox Regression Analysis of Factors Associated with PFS in All Patients
Table 3 Multivariate Cox Regression Analysis of Factors Associated with OS in All Patients
Figure 1 Efficacy of anlotinib in all patients. (A) The PFS of all patients; (B) the OS of all patients; (C) the waterfall plot of tumor best response compared with baseline measurable lesions. *The target lesions shrink but new metastases appear.
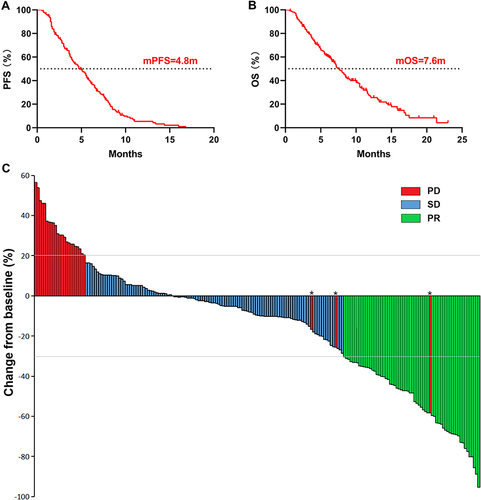
Figure 2 The PFS in monotherapy and combination groups.
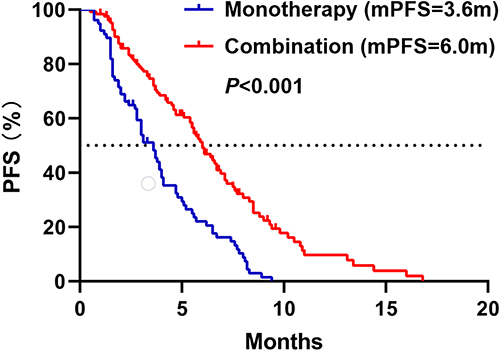
Figure 3 Subgroup analysis of PFS.
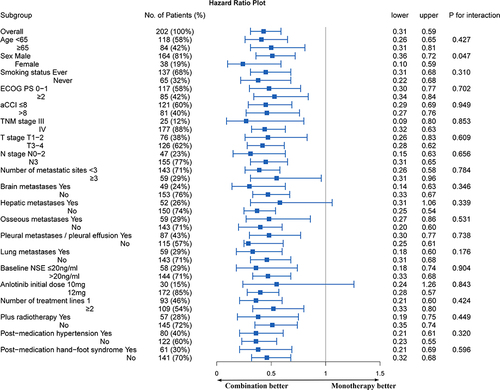
Figure 4 The OS in monotherapy and combination groups.
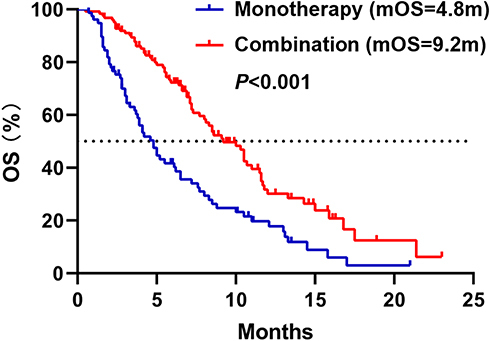
Figure 5 Subgroup analysis of OS.
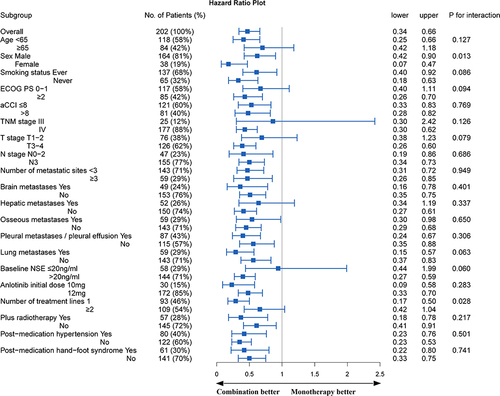
Table 4 Comparison of Efficacy Between Monotherapy and Combination
Figure 6 Kaplan–Meier curves of different number of treatment lines. (A) PFS of first-line treatment; (B) OS of first-line treatment; (C) PFS of second-line and above treatment; (D) OS of second-line and above treatment.
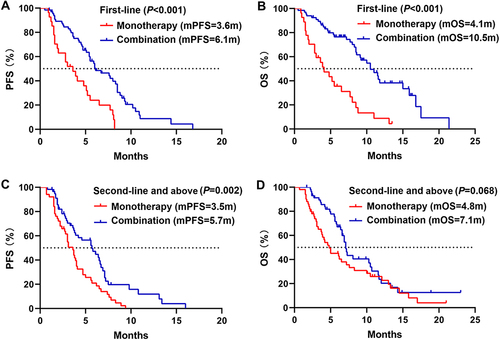
Table 5 Summary of Adverse Reactions