
Figures & data
Figure 1 Patient flow.
Abbreviations: AFA, afatinib; CTX, chemotherapy; DACO, dacomitinib; ECOG, Eastern Cooperative Oncology Group; EGFR+, epidermal growth factor receptor positive; EGFR TKI, epidermal growth factor receptor tyrosine kinase inhibitor; ERLO, erlotinib; GEFI, gefitinib; OSI, osimertinib; PD, disease progression.
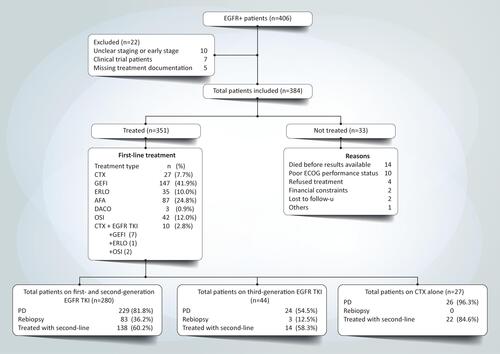
Table 1 Baseline Characteristics of Patients in the Analysis Set (N = 351)
Figure 2 Time on treatment (TOT) according to first-line treatment excluding patients lost to follow-up (N=279).
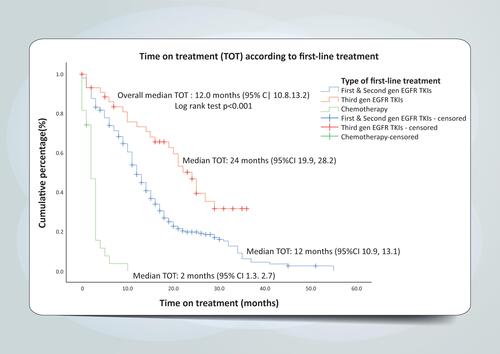
Figure 3 Overall survival (OS) according to first-line treatment excluding patients lost to follow-up (N=250).
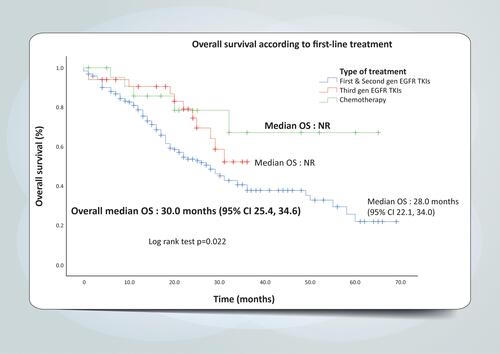
Figure 4 Overall survival (OS) after first-line first- and second-generation EGFR TKIs with and without third-generation EGFR-TKI.
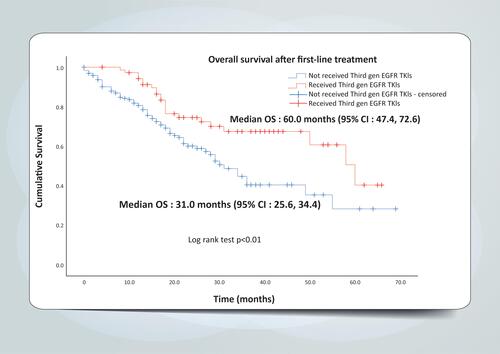
Table 2 Second-Line Treatment in Patients Who Progressed After First-Line Treatment