Figures & data
Table 1 Clinical Features of All Primary Small Intestinal Diffuse Large B-Cell Lymphoma
Table 2 Univariate and Multivariate Analyses of Factors Associated with OS in Training Set
Figure 1 A survival nomogram for predicting 1-year, 3-year and 5-year survival rates of primary small intestinal diffuse large B-cell lymphoma patients.
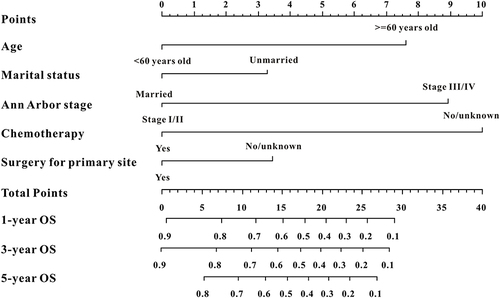
Figure 2 Decision curves analysis (DCA) for the survival nomogram to predict OS. (A) The DCA of nomogram for OS in training cohort; (B) the DCA of nomogram for OS in internal validation cohort; (C) the DCA of the survival nomogram for OS in external validation cohort.
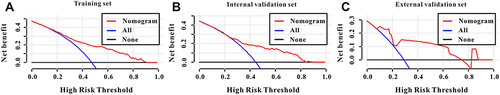
Figure 3 The predictive performances of the survival nomogram for predicting 1-year, 3-year and 5-year OS in PsI-DLBCL. ROC curves displayed that this survival nomogram discriminated well in training set (A), internal validation set (B) and external validation set (C).
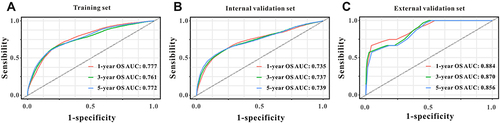
Figure 4 The calibration curves for predicting OS in PsI-DLBCL patients. (A–C) Calibration plots of 1-year, 3-year and 5-year mortality in training cohort; (D–F) calibration plots of 1-year, 3-year and 5-year mortality in internal validation cohort; (G–I) calibration plots of 1-year, 3-year and 5-year mortality in external validation cohort. Nomogram-predicted probabilities of OS were plotted on the x-axis, actual observed outcomes were plotted on the y-axis.
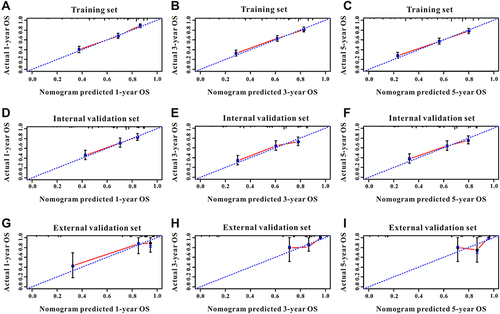
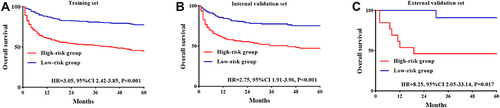
Figure 5 Kaplan–Meier curves of the high-risk and low-risk group of PsI-DLBCL patients stratified by the survival nomogram predicted probabilities in training set (A). internal validation set (B) and external validation set (C).