Figures & data
Table 1 The Clinical Characteristics of Patients with Breast Cancer in the TCGA Database
Table 2 Primers Used for qRT-PCR
Figure 1 SLC7A5 expression levels in different human cancer types. (A) Increased or decreased SLC7A5 in different cancer datasets compared with unpaired normal tissues in the TCGA data. (B) SLC7A5 was prominently overexpressed or underexpressed with pairs of noncancerous adjacent tissues using the Wilcoxon signed-rank test. (C) SLC7A5 expression in breast cancer cells such as SKBR3, SUM1315, and MCF-7 was higher than that in MCF-10a normal breast cells by RT-PCR. (D) TCGA dataset based SLC7A5 expression level analysis between normal and tumor breast tissues. The SLC7A5 was overexpressed in tumor breast tissues. (E) SLC7A5 was prominently overexpressed in breast cancer tissues compared with 112 pairs of noncancerous adjacent tissues using the Wilcoxon signed-rank test. (ns>0.05, *<0.05, **<0.01, ***<0.001).
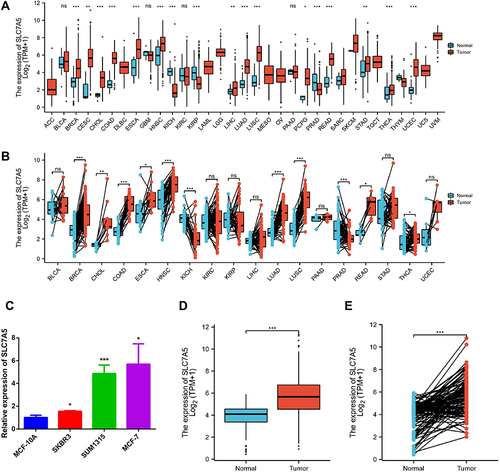
Figure 2 Kaplan–Meier survival curves comparing high and low SLC7A5 expressions in breast cancer. In the Kaplan–Meier plotter database, high SLC7A5 expression correlated with poor survival especially in patients with lymph node metastasis. (A) SLC7A5 expression displayed a poor OS, DSS and PFI in breast cancer. (B) The High SLC7A5 expression in N I–III also correlated with bad OS, DSS and PFI.
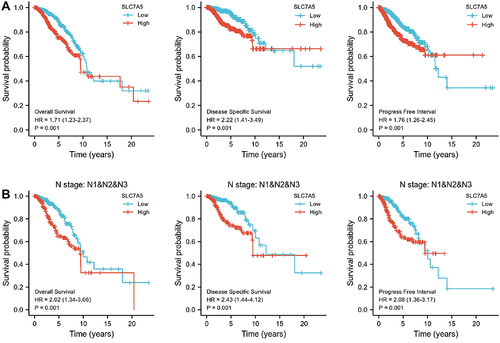
Figure 3 Correlation between SLC7A5 expression and immune cell infiltration levels. (A) Correlation between SLC7A5 and different immune cell infiltration levels in breast cancer. (B) Enrichment of different tumor-infiltrating immune cells in breast cancer with low or high SLC7A5 expression. (ns>0.05, *<0.05, ***<0.001).
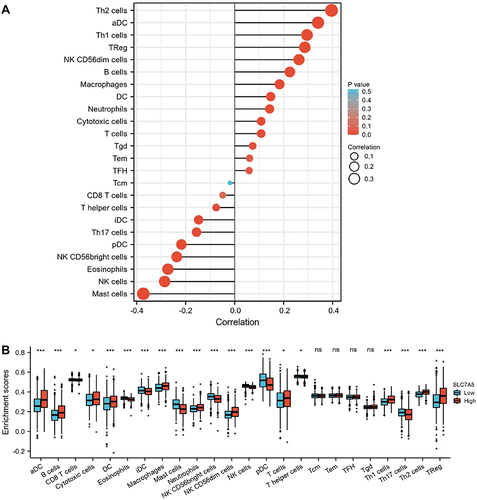
Figure 4 (A) Correlation between SLC7A5 expression and three types of infiltrating immune cells: Th1, Th2, and Treg cells. The relationship between the SLC7A5 expression and specific cell surface markers of Th1 (B), Th2 (C), and Treg (D) cells.
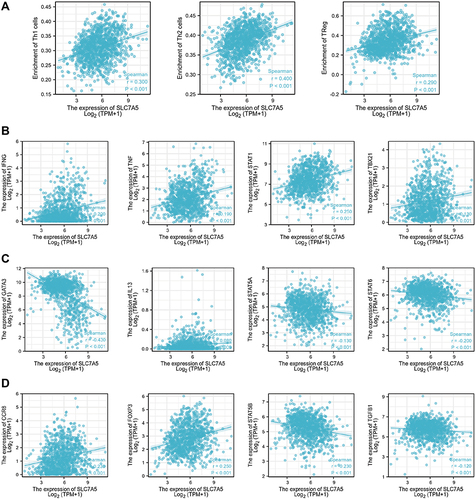
Figure 5 Correlation analysis of SLC7A5 expression with classic marker genes from (A) immune stimulators and (B) immune checkpoint markers in breast cancer samples. SLC7A5 expression positively correlated with IDO1, LAG3, IL2RA, PVR, and ULBP1, whereas it negatively correlated with CXCL12.
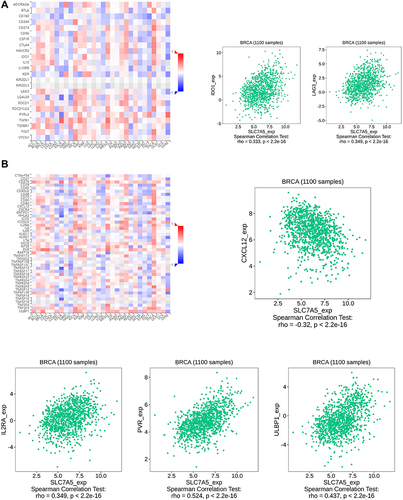
Figure 6 Correlation analysis of SLC7A5 expression with classic marker genes from (A) chemokine receptors and (B) chemokines in breast cancer samples.
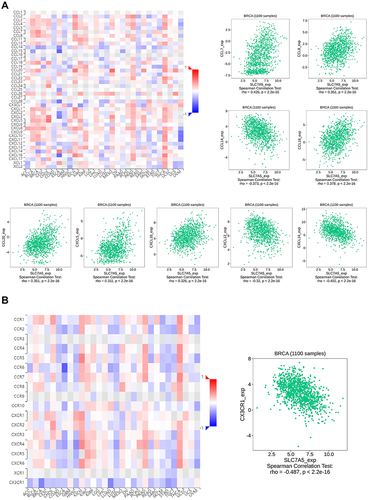
Figure 7 Enrichment plots from the Gene Set Enrichment Analysis (GSEA). (A) GSEA results showing differential enrichment of genes in REACTOME with high SLC7A5 expression. (B) Heatmap of related genes in breast cancer with different SLC7A5 expressions.
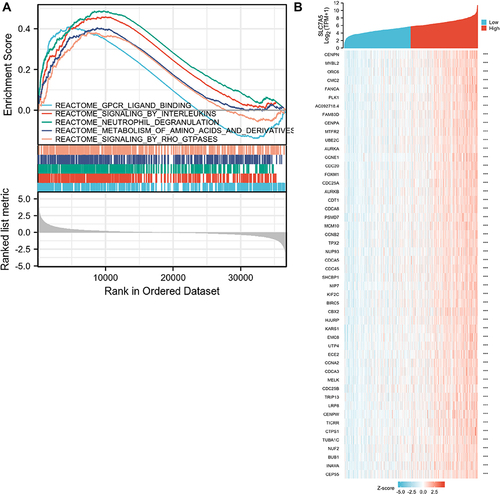
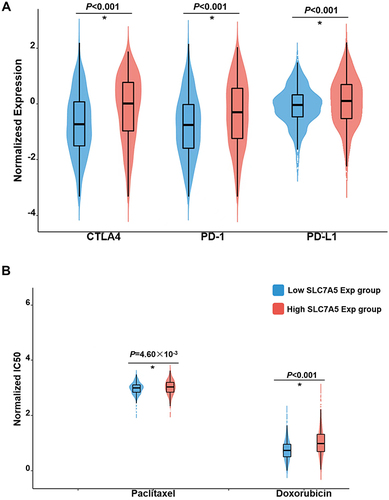
Figure 8 The sensitivity in immunotherapy and chemotherapy between the high and low SLC7A5 expression groups. IC50, half-maximal inhibitory concentration. (A) Higher sensitivity in the low-SLC7A5-expression group than in the high-SLC7A5-expression group. (B) SLC7A5-expression in two chemotherapeutic drugs, paclitaxel and doxorubicin, in breast cancer therapy. (*p < 0.05).