Figures & data
Figure 1 The flow chart of patient selection and data process.
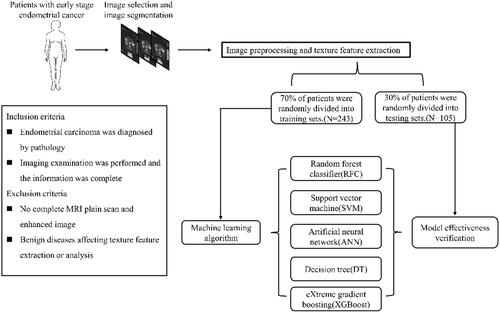
Table 1 Baseline Demographic and Clinicopathological Characteristics of Patients
Figure 2 Variable screening and weight allocation. (A) Correlation matrix analysis of candidate features. (B) The weight distribution of the candidate variables of each ML-based model.
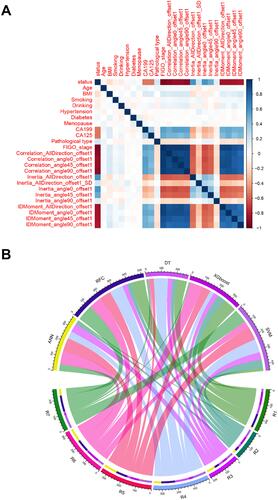
Figure 3 Predictive model visualization based on ML-based algorithm. (A) RFC model. (B) DT model. The candidate factors associated with myometrial invasion were ordered via RFC algorithm (A, B) prediction node, and weight was allocated via DT algorithm.
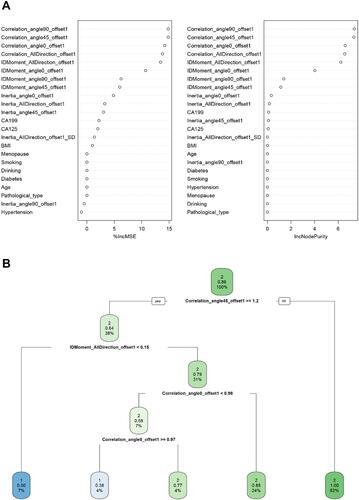
Figure 4 Predictive model visualization based on ANN algorithm. The candidate factors associated with myometrial invasion were ordered via the ANN algorithm. Red represents the positive weight, and blue represents the negative weight.
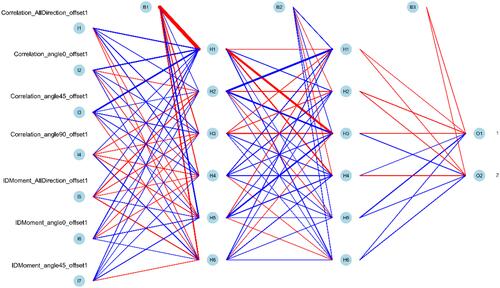
Table 2 The ROC Curve Analyses for Predicting Myometrial Invasion in Each ML-Based Model
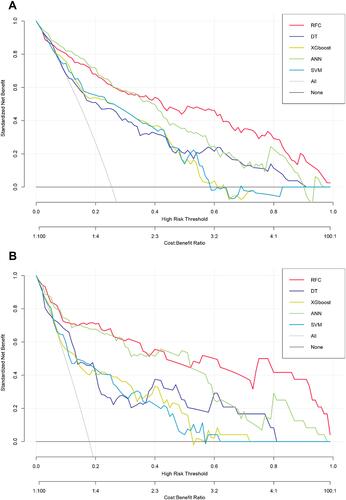
Figure 5 Prediction performance of candidate models based on ML-based algorithm. (A) DCA for five ML-based models in the training set. (B) DCA for five ML-based models in the testing set.