
Figures & data
Table 1 Baseline Characteristics of Patients Before and After Matching
Figure 1 Kaplan-Meier survival curves of OS (A), LRRFS (B), DMFS (C), and DFS (D) of patients between IC+CCRT and CCRT alone in the matched data set.
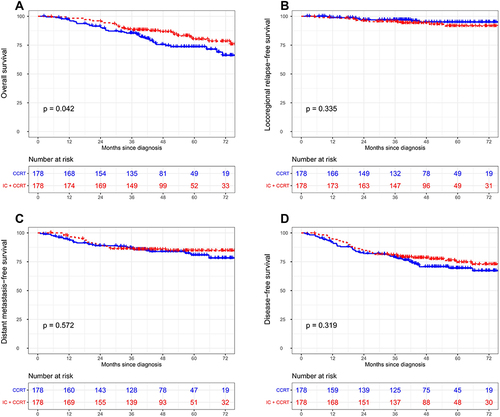
Table 2 Identification of Risk Factors of OS by Univariate and Multivariate Cox Models
Figure 2 (A) Nomogram for predicting OS; Calibration curves of the nomogram in the training (B) and validation (C) cohorts.
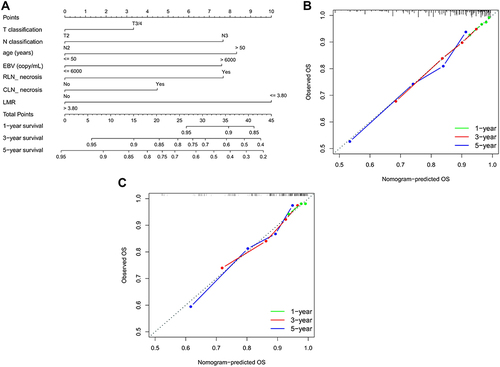
Figure 3 Time-dependent receiver operating characteristic (tdROC) curves of 3- and 5-year OS for respective comparison of the nomogram with the 8th TNM staging system in the training (A and C) and validation cohort (B and D).
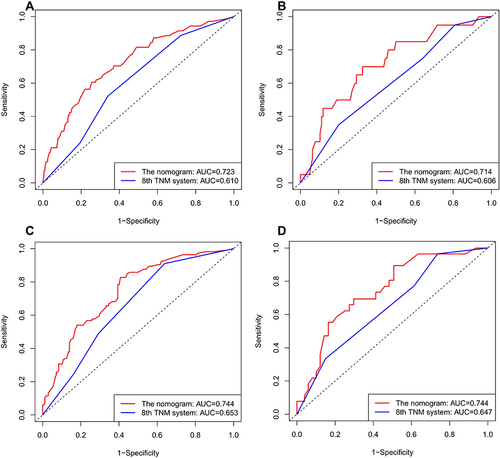
Figure 4 Kaplan-Meier survival curves of OS (A), LRRFS (B), DMFS (C), and DFS (D) of patients between IC+CCRT and CCRT alone in the nomogram-defined high-risk group after matching.
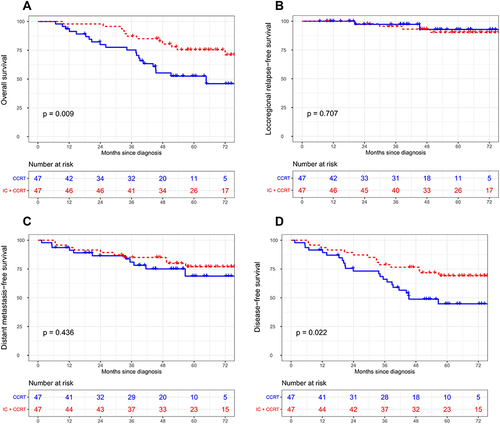
Table 3 Acute Adverse Events of Patients in the CCRT and IC+CCRT Groups