Figures & data
Figure 1 Nontoxic doses of selenite enhance cytotoxicity in PC-3 cells sensitized with carmustine. (A) Prostate cancer cells (LNCaP, DU145, and PC-3) and normal prostate epithelial cells (PZ-HPV-7) were treated with different concentrations of selenite (0.5–10 μM) for 48 hours. Cell viability was then determined as described in the Materials and methods section. Data are presented as the mean ± standard deviation (*P < 0.05; n = 4) and expressed as a percentage of viable cells. Data were normalized to the control. (B) PC-3 and (C) DU145 cells were pretreated with 10 or 20 μM carmustine for 30 minutes and then treated with the indicated concentrations of selenite (0.5–10 μM) for 48 hours. Cell viability was then determined. The data are presented as the mean ± standard deviation. (*P < 0.05; n = 3) and expressed as the percentage of viable cells. Data are normalized to the control. Comparisons shown: (a) significant compared with vehicle-treated control; (b) significant compared with 1.5 μM selenite-treated cells; (c) significant compared with 2.5 μM-selenite-treated cells.
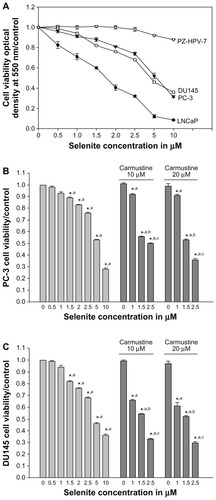
Figure 2 Nontoxic doses of selenite enhance growth inhibition and inhibit DNA synthesis in PC-3 cells sensitized with carmustine. PC-3 cells were pretreated with 10 or 20 μM carmustine for 30 minutes and then treated with different concentrations of selenite (0.5–5 μM) for 96 hours. (A) Cell growth and (B) DNA synthesis were then determined as described in the Materials and methods section. The data are presented as the mean ± standard deviation. (*P < 0.05; n = 3) and expressed as optical density at 550 nm for cell growth; optical density at 405 nm for DNA synthesis. Data are normalized to the control. Comparisons shown: (a) significant compared with control; (b) significant compared with 1.5 μM selenite-treated cells; (c) significant compared with 2.5 μM selenite-treated cells.
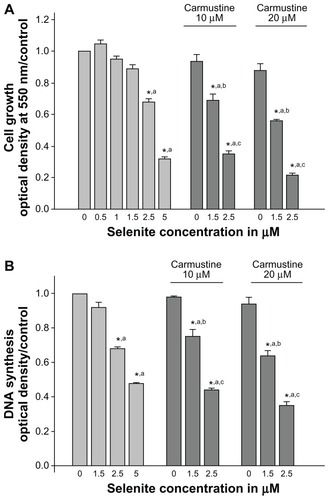
Figure 3 Nontoxic doses of selenite decrease glutathione reductase and glutathione in PC-3 cells sensitized with carmustine. (A) PC-3 cells were treated with the indicated concentrations of carmustine (10–40 μM) for 6 hours. Glutathione reductase activity was then measured as described in the Materials and methods section. Each assay was performed in duplicate. The data are presented as the mean ± standard deviation (*P < 0.05; n = 3) and expressed as nanomoles of NADPH oxidized per minute per milligram of protein. Data are normalized to the control. Comparisons shown: (a) significant compared with vehicle-treated control. (B) PC-3 cells were pretreated with 20 μM carmustine for 30 minutes and then treated with the indicated concentrations of selenite (2.5–5 μM) for 6, 12, and 24 hours. Glutathione levels were then determined as described in the Materials and methods section. Data are presented as the mean ± standard deviation (*P < 0.05; n = 3) and expressed as μmoles/mg protein. Data are normalized to the control. Comparisons shown: (a) significant compared with control; (b) significant compared with 2.5 μM selenite-treated cells. (C) PC-3 cells were pretreated with 10 or 20 μM carmustine for 30 minutes and then treated with the indicated concentrations of selenite (2.5–5 μM) for 6 hours. Glutathione reductase activity was determined as described in the Materials and methods section. The data are presented as the mean ± standard deviation (*P < 0.05; n = 3) and expressed as nanomoles of NADPH oxidized per minute per milligram of protein. Data are normalized to the control. Comparisons shown: (a) significant compared with control; (b) significant compared with 2.5 μM selenite-treated cells.
Abbreviations: GSH, glutathione; GR, glutathione reductase.
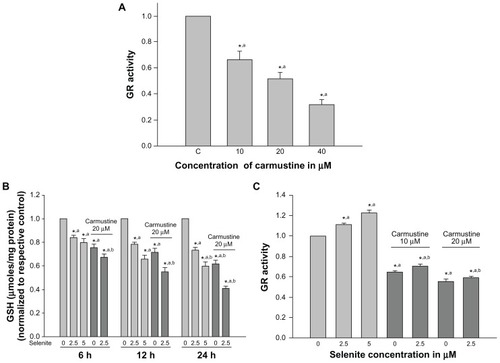
Figure 4 Nontoxic doses of selenite enhance generation of reactive oxygen species in PC-3 cells sensitized with carmustine. PC-3 cells were pretreated with 10 or 20 μM carmustine for 30 minutes and then treated with the indicated concentration of selenite (1.5–5 μM) for 2 hours. Generation of reactive oxygen species was then measured as described in the Materials and methods section. The data are presented as the mean ± standard deviation (*P < 0.05; n = 3) and expressed as relative fluorescence (%). Data are normalized to the control. Comparisons shown: (a) significant compared with control; (b) significant compared with 1.5 μM selenite-treated cells; (c) significant compared with 2.5 μM selenite-treated cells.
Abbreviation: DCF, Dichlorofluorescein.
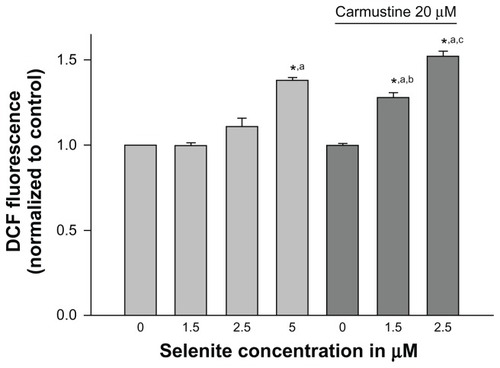
Figure 5 Nontoxic doses of selenite enhance apoptosis in PC-3 cells sensitized with carmustine, and this enhancement is mediated through oxidative stress. (A) PC-3 cells were pretreated with 10 or 20 μM carmustine for 30 minutes and then treated with the indicated concentrations of selenite (1.5–5 μM) for 24 hours. Apoptosis was then determined by enzyme-linked immunosorbent assay as described in the Materials and methods section. The data are presented as the mean ± standard deviation (*P < 0.05; n = 3) and expressed as optical density at 405 nm. Data are normalized to the control. Comparisons shown: (a) significant compared with control; (b) significant compared with 1.5 μM selenite-treated cells; (c) significant compared with 2.5 μM selenite-treated cells. (B) PC-3 cells were pretreated with 20 μM carmustine for 30 minutes and then treated with 10 μM MnTMPyP along with 2.5 or 5 μM selenite for 24 hours. Apoptosis was then determined as described in the Materials and methods section. The data are presented as the mean ± standard deviation (*P < 0.05; n = 3) and expressed as optical density at 405 nm. Data are normalized to the control. Comparisons shown: (a) significant compared with the respective control; (b) significant compared with 2.5 μM selenite-treated cells; (c) significant compared with 5 μM selenite-treated cells; (d) significant compared with carmustine-treated cells; (e) significant compared with carmustine-treated and selenite-treated cells.
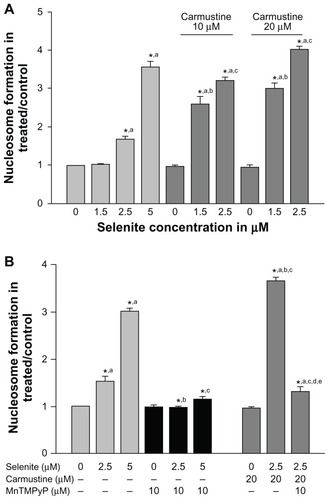
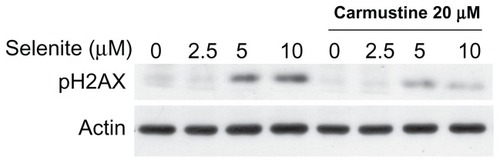
Figure 6 Nontoxic doses of selenite decrease the expression of antiapoptotic proteins, triggered PARP cleavage, and induced DNA double-strand breaks in PC-3 cells sensitized with carmustine. Prostate cancer cells were pretreated with 10 or 20 μM carmustine for 30 minutes and then treated with the indicated concentrations of selenite (1.5–5 μM) for 24 hours. Cell lysates were prepared as described in the Materials and methods section. (A) Bcl-2 and (B) Mcl-1 protein expression were determined by Western blot analysis in PC-3 cells. A typical Western blot from 1 of 3 experiments is shown. Densitometric analysis was performed on samples to evaluate the levels of Bcl-2 and Mcl-1 protein expression in a quantitative manner. Graph represents the ratio of Bcl-2 or Mcl-1 protein expression over β-actin (bottom panel). Data are normalized to control. Comparisons shown: (a) significant compared with control; (b) significant compared with 1.5 μM selenite-treated cells; (c) significant compared with 2.5 μM selenite-treated cells; (d) significant compared with 5.0 μM selenite-treated cells; (e) significant compared with 10 μM carmustine-treated cells; and (f) significant compared with 20 μM carmustine-treated cells. (C) Phospho-H2AX (a marker of DNA double-strand breaks) was determined by Western blot analysis in PC-3 cells as described in the Materials and methods section. The blots shown are representative of three separate experiments. β-actin was used as a loading control. (D) PARP protein expression was determined by Western blot analysis in PC-3 and LNCaP cells as described in the Materials and methods section. The blots shown are representative of three separate experiments. β-actin was used as a loading control.
Abbreviation: MW, molecular weight.
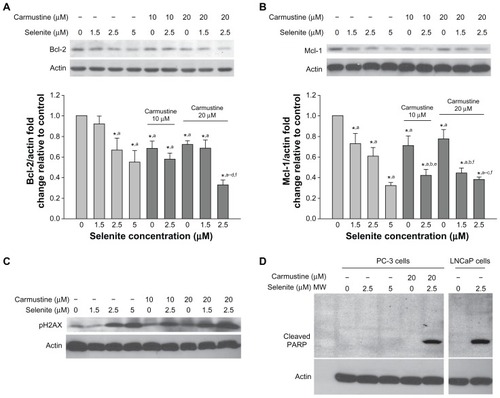
Figure 7 Absence of genotoxicity in normal prostate epithelial cells treated with a combination of nontoxic doses of selenite and carmustine. PZ-HPV-7 cells were pretreated with 20 μM carmustine for 30 minutes and then treated with the indicated concentrations of selenite (2.5–10 μM) for 24 hours. The expression of phospho-H2AX protein, a marker of DNA double-strand breaks, was then determined by Western blot analysis as described in the Materials and methods section. The blots shown are representative of three separate experiments. β-actin was used as a loading control.