Figures & data
Table 1 Primers for Validation
Figure 1 Establishment of radiotherapy resistant cell line. (A) The diagram of establishment of radiotherapy resistant cells. (B) X ray irradiation of 0, 2, 4, 6 and 8Gy. After 2 weeks of cultivation, then fixed with 4% paraformaldehyde and stained with crystal violet in the colony formation experiment. (C) Clone formation rate according to B, the results were calculated according to the ratio of clone number to inoculated cell number. (D) Survival fraction according to B. (E) Heatmap of DEGs screened by microarray analysis, red areas represent highly expressed genes and blue areas represent lowly expressed genes in A549-RR subjects compared with A549 subjects. (F) Differential gene volcano map between the case and control group. The dotted line indicates p = 0.05. ***p < 0.001.
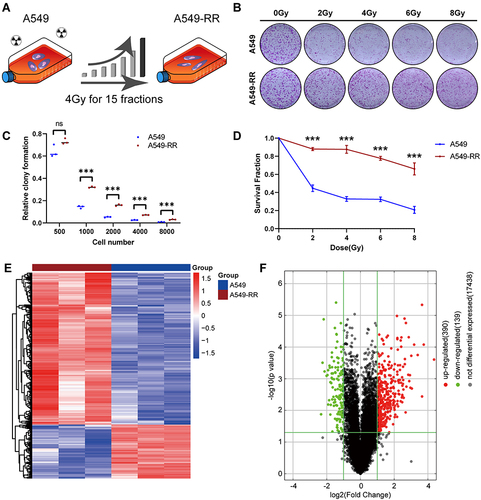
Figure 2 Function and mechanism analysis of altered expression of DEGs. (A) GO analysis of the up regulated DEGs. (B) KEGG pathway analysis of the up regulated DEGs. (C) GO analysis of the down regulated DEGs. (D) KEGG pathway analysis of the down regulated DEGs. The top-three most significant up-regulated enriched gene sets in the resistance subjects: NOD-like receptor signaling pathway (E), TNF signaling pathway (F), Necroptosis (G).
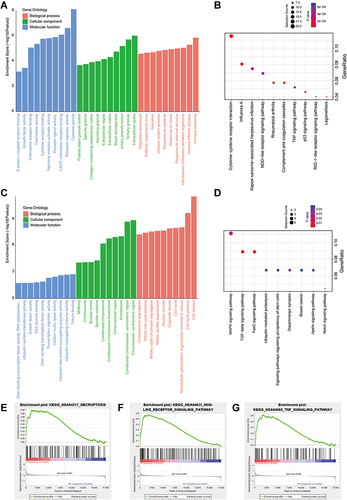
Figure 3 Identification and validation of hub genes. (A) The PPI network was analyzed by String software. (B) Identified the hub gene by Cytohubba. CXCL10, IFIH1, DDX58, CXCL11, RSAD2 were calculated as the top 5 hub genes. (C) Different expression of the top 5 hub genes in cases and controls verified using qRT-PCR. (D) The relative expression of cytokine in case and control groups using ELISA. Each experiment consisted of three biological replicates. **p < 0.01, ***p < 0.001.
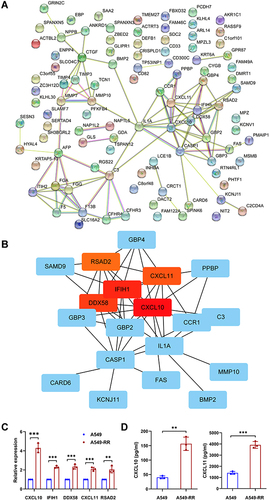
Figure 4 Correlation analysis between hub genes expression and immune infiltration of CD8+T cell. (A) Different algorithms were performed to explore the relationship between the expression level of the hub genes and the infiltration level of CD8+T cell across all types of cancer in TCGA. (B) The scatterplot data of the lung adenocarcinoma produced using one algorithm. (C) The chemotaxis of CD8+T cell between case and control group were detected by flow cytometry. (D) Quantification of data in C. Each experiment consisted of three biological replicates. **p < 0.01.
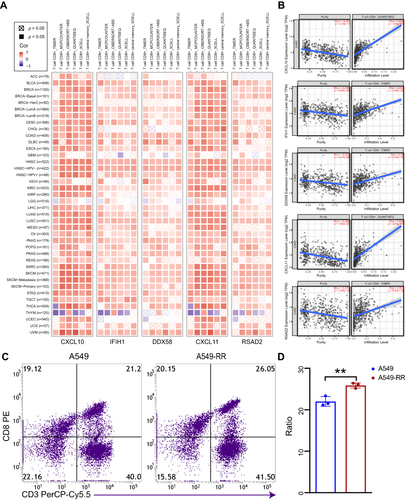
Table 2 ChIP-X Enrichment Analysis Results
Figure 5 Effects of STAT1 inhibitor on radiotherapy resistance. (A) The expression levels of total STAT1 and p-STAT1 (Y701). (B) Relative expression of STAT1 and p-STAT1. (C) Relative expression of PD-L1. (D) The expression levels of PD-L1. (E) Quantification of PD-L1 expression. (F) A549-RR cells were planted and incubated with STAT1 inhibitor (S1491, Selleck, 2μg/mL, 24h) followed by radiotherapy and then cultured for 2 weeks. (G) Clone formation rate according to D, the results were calculated according to the ratio of clone number to inoculated cell number. (H) Survival fraction according to D. *p < 0.05, **p < 0.01, ***p < 0.001.
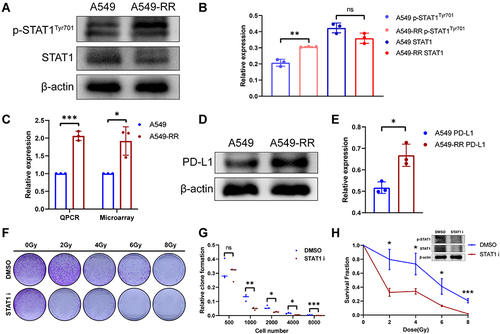
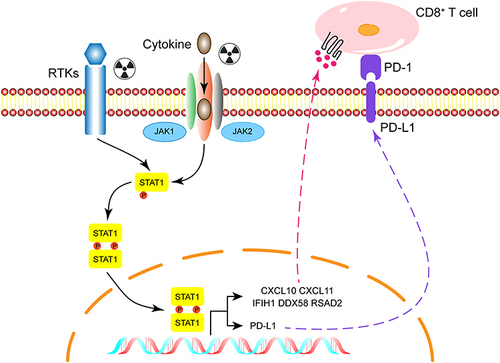
Figure 6 Diagram of potential mechanisms of radiation resistance.