
Figures & data
Figure 1 (A) Gram stain: Gram-negative bacteria appear red when stained. Original magnification 1000×. (B) F. nucleatum was positive by immunohistochemistry, original magnification 1000×. C-P: Immunohistochemical detection. Original magnification 400×. (C) Negative F. nucleatum expression in paracancerous tissue, (D) positive F. nucleatum expression in paracancerous tissue, (E) negative F. nucleatum expression in cancer tissue, (F) positive F. nucleatum expression in cancer tissue, (G) negative MLH-1 expression, (H) positive MLH-1 expression, (I) negative MSH2 expression, (J) positive MSH2 expression, (K) negative PMS2 expression, (L) positive PMS2 expression, (M) negative MSH6 expression, (N) positive MSH6 expression, (O) negative HER-2 expression, (P) positive HER-2 expression.
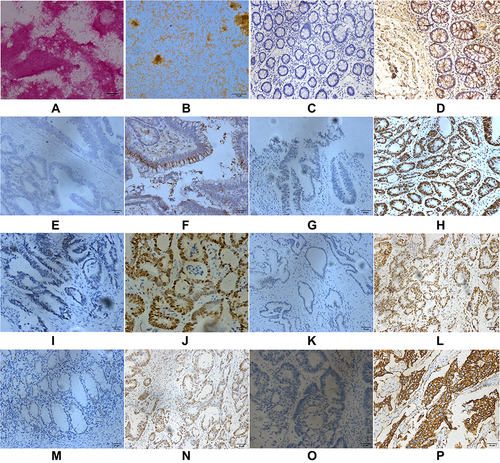
Table 1 Clinical Features of CRC Patients
Table 2 Clinical and Molecular Features of CRC According to Microsatellite Status n (%)
Table 3 Comparison of the Positive Rate of F. nucleatum Infection in CRC Tissues and Adjacent Noncancerous Tissues in Patients with CRC n (%)
Table 4 F. nucleatum Infection in CRC Tissues and Adjacent Noncancerous Tissues in CRC Patients with Different TNM Stages
Table 5 Clinical and Molecular Features of CRC According to F. nucleatum Infection
Table 6 Correlation Analysis of Clinical-Pathological Indices with CRC
Table 7 Receiver Operating Characteristic Curve Analysis of Parameters
Table 8 Cox Regression Analysis of Prognostic Factors in Patients with CRC
Table 9 Univariate Analysis of the Impact of Possible Risk Factors on Disease-Free Survival in CRC Patients
Figure 2 Kaplan–Meier survival curves were used to evaluate the suitability of these molecules as prognostic factors. The results showed that the DFS in the F. nucleatum-negative group was significantly longer than that in the F. nucleatum-positive group. Older people (>60 years old) had a significantly shorter DFS than younger people (<60 years old), and patients with TNM stage III–IV had significantly a shorter DFS than those with TNM stage I–II. Patients with colon cancer had a shorter DFS than those with rectal cancer.
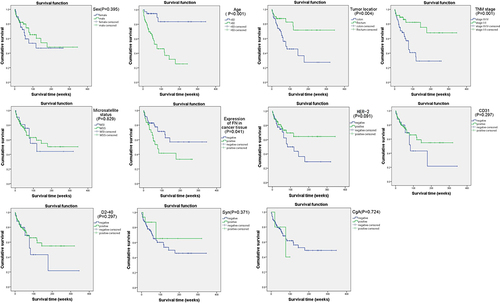
Table 10 Loading Scores of Variables on the First Three Significant Principal Components That Combined Components for the Analysis of Prognosis
Table 11 Receiver Operating Characteristic Curve Analysis of Components