
Figures & data
Table 1 Patients’ Characteristics
Figure 1 Clinical outcomes of the whole group analysis (n = 47). BOR (A), OS (B), and PFS (C).
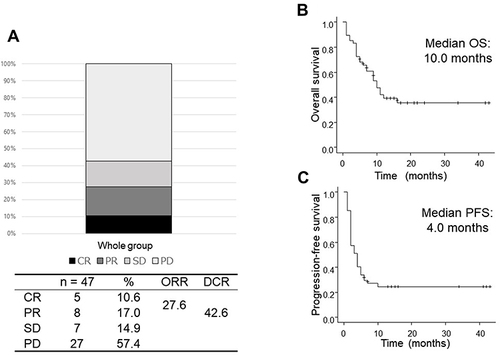
Figure 2 Best overall response of the patients divided by AEC (A), REC (B), and NER (C). (A) AEC ≥0.9 × 10³/μL: CR 12.5%, PR 21.9%, SD 12.5%, and PD 53.1%. AEC <0.9 × 10³/μL: CR 6.7%, PR 6.7%, SD 20.0%, and PD 66.7%. Odds ratio for ORR and DCR was 0.294 (p = 0.147) and 0.567 (p = 0.384), respectively. (B) REC ≥2.2%: CR 15.0%, PR 25.0%, SD 20.0%, and PD 40.0%. REC <2.2%: CR 7.4%, PR 11.1%, SD 11.1%, and PD 70.4%. Odds ratio for ORR and DCR was 0.341 (p = 0.110) and 0.281 (p = 0.041), respectively. (C) NER ≥32: CR 4.3%, PR 8.7%, SD 13.0%, and PD 73.9%. NER <32: CR 16.7%, PR 25.0%, SD 16.7%, and PD 41.7%. Odds ratio for ORR and DCR was 4.76 (p = 0.361) and 3.97 (p = 0.0287), respectively.
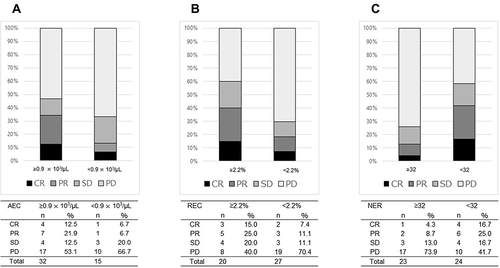
Figure 3 The overall survival (OS) of the patients divided by AEC (A), REC (B), and NER (C). (A) The median OS was 9.0 months in patients with AEC <0.9 × 10³/μL vs 12.0 months in those with AEC ≥0.9 × 10³/μL (p = 0.046). (B) The median OS was 9.0 months in patients with REC <2.2% vs unreached in those with REC ≥2.2% (p = 0.027). (C) The median OS was unreached in patients with NER <32 vs 6.0 months in those with NER ≥32 (p = 0.035).
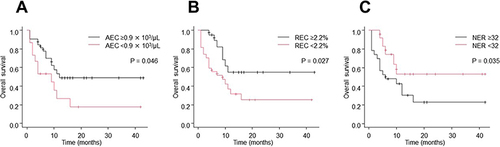
Figure 4 The progression-free survival (PFS) of the patients divided by AEC (A), REC (B), and NER (C). (A) The median PFS was 2.0 months in patients with AEC <0.9 × 10³/μL vs 4.0 months in those with AEC ≥0.9 × 10³/μL (p = 0.206). (B) The median PFS was 2.0 months in patients with REC <2.2% vs 4.0 months in those with REC ≥2.2% (p = 0.052). (C) The median PFS was 4.5 months in patients with NER <32 vs 2.0 months in those with REC ≥32 (p = 0.013).
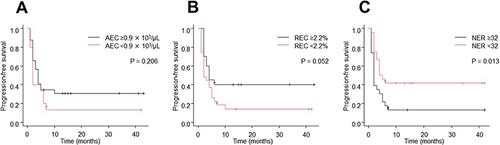
Table 2 Univariate and Multivariate Analyses of the Factors Associated with the Overall Survival of Patients Treated with Nivolumab