Figures & data
Figure 1 Metformin inhibited proliferation of human colorectal cell lines HCT116 (A) and SW620 (B). For this proliferation assays, 10,000 to 20,000 cells were seeded in 96-well plates, and after 24 hours of plating, treated with 0, 1, 2.5, 5, and 10mM metformin and cultured for 24, 48, and 72 hours. MTS reagent was added and absorbance of formazan product was read at 490 nm. The absorbance of untreated control was set at 100% viability. The concentration and time dependence were determined by two-way ANOVA. HCT116 (A) showed a very significant concentration and time dependence (P < 0.0001). SW620 (B) showed a very significant concentration dependence (P<0.0001) but no significant time dependence. The data are presented as the mean ± SD from three experiments.
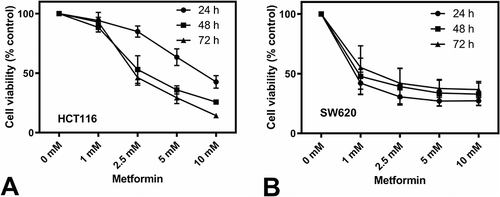
Figure 2 Clonogenic assay with HCT116 (A) and SW620 (B). 250 HCT 116 cells were seeded in 12-well plates and 200 SW620 cells were seeded in 24-well plates. After 24 hours medium was changed to a fresh medium containing 0, 1, 2.5, 5, and 10 mM metformin. Cells were incubated for 10–12 days (HCT116) or 14 days (SW620) and colonies stained with crystal violet were counted. The data are presented as the mean ± SD from at least three experiments. P-value of <0.001 is represented as *** and of <0.0001 as ****.
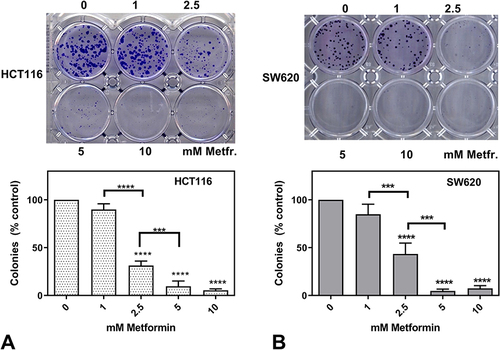
Figure 3 Metformin caused cell death in HCT116 (A) and SW620 (B) cell lines in a concentration-dependent manner. For flow cytometry analysis, cells were cultured in 12 well plates to 70–80% confluency, followed by treatment with 0–20 mM metformin for 48 hours. Cells were harvested and labeled with YO-PRO-1/PI (VybrantTM Apoptosis Assay Kit #4, #V13243, Thermofisher) according to the manufacturer’s instructions. Quadrants are defined using controls of unlabeled cells, cells labeled only with YO-PRO-1, and cells labeled only with PI. Necrotic cells, if any, are found in the upper left quadrant on the cytogram (UL), whereas the viable cells are in the lower left quadrant (LL). Cells in the early phase of apoptosis are in the lower right (LR) and those in the late apoptosis (“dead cells”) are in the upper right quadrant (UR). Flow cytograms show representative data from a single experiment (upper panel). Quantification of the percentage of viable, apoptotic, and dead cells was derived from three independent experiments. Data show mean values ±SD from three independent experiments (lower panel).
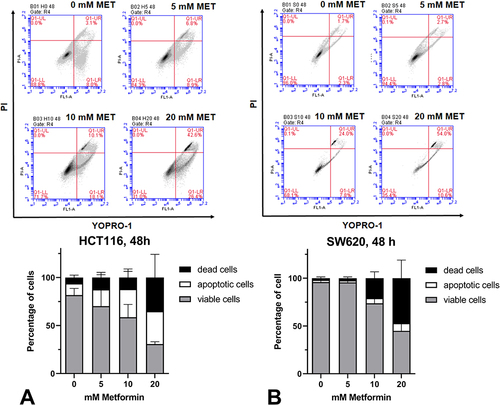
Figure 4 Metformin did not induce caspase 3 activity in HCT116 cells. For the caspase 3 activity assay, lysates were prepared from 107 untreated cells (0 mM metformin), cells treated with 5 mM and 10 mM metformin for 48 hrs. As an apoptosis-positive control, HCT116 cells were treated with 0.1 mM sodium deoxycholate (NaDOC) for 2 hours before protein isolation. Recombinant caspase 3 (a component of the kit) served as a positive control for the caspase 3 reaction (Casp3). Ten μL of lysates were applied in one reaction, and each was added with caspase 3 substrate (Ac-DEVD-pNA) and caspase 3 substrate + caspase 3 inhibitor (Ac-DEVD-CHO). Caspase 3 activity is presented in nmol pNA/min/mL (Caspase 3 Assay Kit, #CASP-3-C, Sigma). Data show mean values ±SD from three independent experiments.
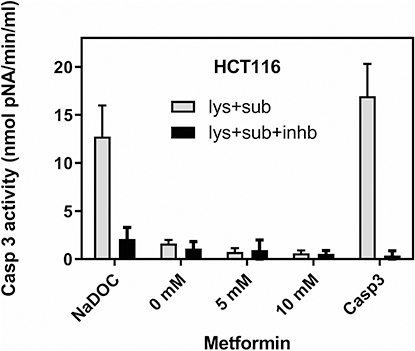
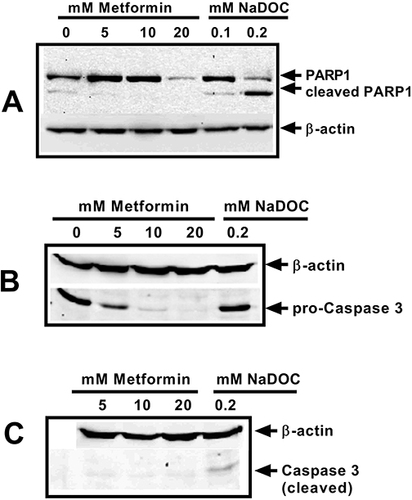
Figure 5 Metformin did not induce PARP1 cleavage in HCT116 (A). Metformin also did not induce caspase 3 activation in HCT116 cells (B and C). Cells were treated with 0, 5, 10, and 20 mM metformin for 48 hours. As an apoptosis-positive control, HCT116 cells were treated with 0.1 and/or 0.2 mM of sodium deoxycholate (NaDOC) for 3 hours. Protein lysates were prepared as mentioned in Materials and Methods. Thirty μg proteins were loaded on 10–12% SDS PAGE and separated proteins were transferred onto nitrocellulose membranes. Antibody detections were performed using anti-PARP1 antibody (#9542, CST) in (1:1000) dilution in blocking buffer. Loading control used was β-actin (anti-β-actin antibody, #A2066, Sigma). For (B and C), antibody detections were performed using anti-caspase 3 and anti-cleaved caspase 3 antibodies (#9662, CST and #9664, CST) in (1:1000) dilution in blocking buffer. The data shown are representative of three independent experiments.