Figures & data
Figure 1 DNP enhances glycolysis. 1 µmol/L of DNP increased the regulators of glycolysis (A), glucose uptake (B), and glucose usage (C) observed at the end of 4 h was observed in U251 cells. Densitometry analysis of protein level for blots in panel A is shown below, values are average of two or more independent experiments. P values were determined by an unpaired two-tailed Student’s t-test. *P < 0.05; ***P < 0.001.
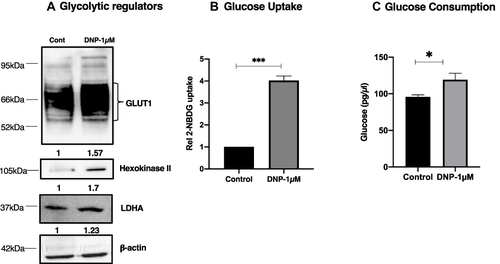
Table 1 Relative Biological Effectiveness (RBE) of Carbon Ion Radiation Calculated at 10% Survival in Human Glioma Cell Lines at 10% Survival
Table 2 Dose Modifying Factor (DMF) Following Stimulation of Glycolysis with DNP in Human Glioma Cell Lines
Figure 2 Elevated glycolysis reduces X-rays but not CII-induced loss of clonogenic survival. Radiation dose-response of clonogenic survival in (A) LN229, (B) U251, and (C) U87 cells were stimulated with DNP (1 µmol/L) just before the irradiation. After 4 h of incubation at 37°C with 5% CO2 cells were plated for colony formation. Colonies were counted at day 8 followed by crystal violet staining and plotted as relative (to Untreated) surviving fraction. Student T test was performed between the given dose group with or without DNP as for Carbon ion irradiation 2 Gy compared with carbon 2 Gy+DNP, Carbon 4 Gy with carbon 4 Gy +DNP, and similarly, for X-rays, 2 Gy with 2 Gy+DNP, 4 Gy with 4 Gy+DNP were compared for the significance of tests. Data represents from three independent experiments. P values were determined by an unpaired two-tailed Student’s t test-test. *P < 0.05; **P < 0.01; ****P < 0.0001.
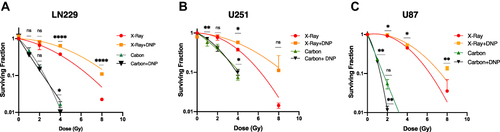
Figure 3 Elevated glycolysis reduces X-rays induced growth inhibition. Relative proliferation index was observed at the end of 48 h post-irradiation (A) X-rays and (B) carbon ions radiation to U251 and LN229 cells with or without DNP stimulation as shown in panel. Data represent three independent experiments. P values were determined by an unpaired two-tailed Student’s t-test. *P < 0.05; **P < 0.01; ***P < 0.001; ****P < 0.0001.
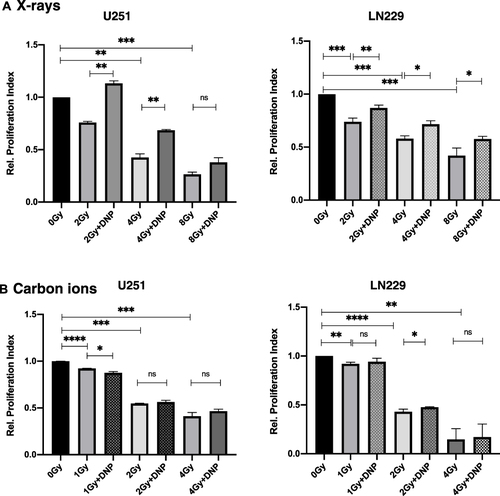
Figure 4 Elevated glycolysis reduced X-rays but not CII induced G2+M delay. Relative G2+M population was observed in response to X-Ray (A) and Carbon ions Irradiation (B) in U251 and LN229 cell lines 48 h as indicated in the panel. Data represents from three independent experiments. P values were determined by an unpaired two-tailed Student’s t-test. *P < 0.05; **P < 0.01; ***P < 0.001; ****P < 0.0001.
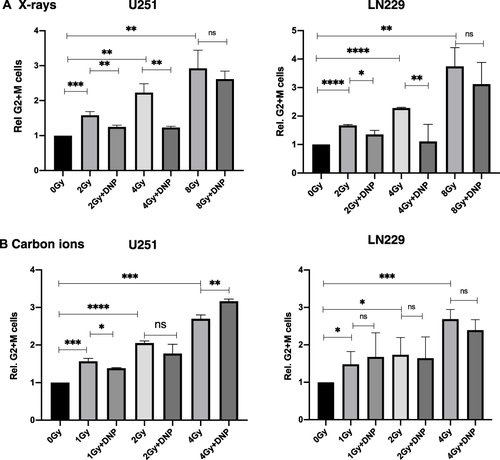
Figure 5 X-rays but not CII induced micronuclei is enhanced by elevated glycolysis. Micronuclei induced by X-rays (A) and Carbon ion radiation (B) in U251 and LN229 cell lines were assessed at 36 h followed by Cytochalasin-B (2.5 µmol/L) incubation. P values were determined by an unpaired two-tailed Student’s t-test. *P < 0.05; **P < 0.01; ***P < 0.001; ****P < 0.0001.
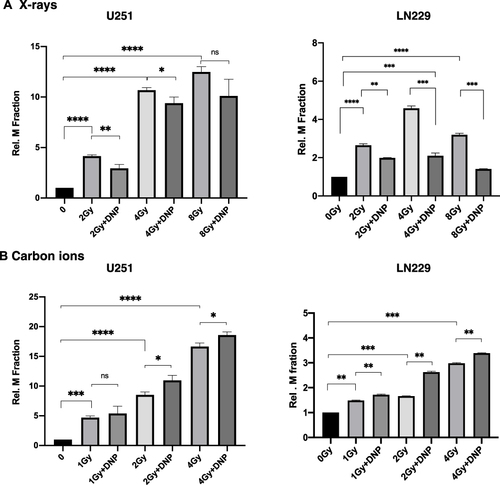
Figure 6 Radiation-induced apoptosis in U251 cells with X-rays and CII. U251 cells were irradiated with X-ray (A) and Carbon ions (B) followed by DNP stimulation. At 24 h, cells were stained with Annexin V/PI for evaluating the apoptotic cells at 2 Gy and 4 Gy doses of both the radiations. Data represented here from three different experiments performed with two technical replicates. P values were determined by paired two-tailed Student’s t-test. P values <0.05 were considered significant. *P < 0.05; ***P < 0.001; ****P < 0.0001.
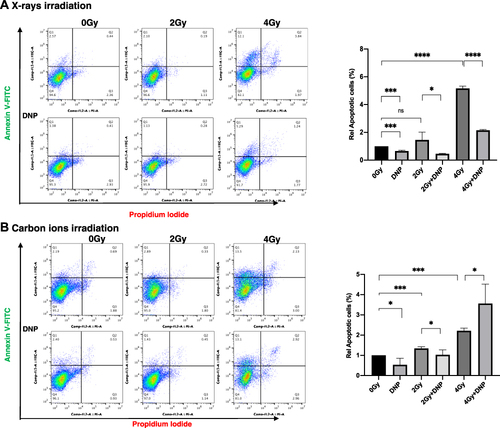
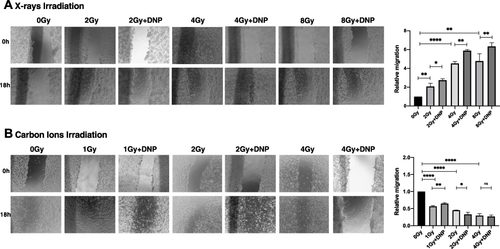
Figure 7 X-rays but not CII-induced migration is enhanced by elevated glycolysis. (A) An in vitro scratch assay was performed in U251 irradiated with X-rays (A) and carbon ions radiation (B) post irradiation. Images captured at 0h and 18h with the indicated groups. Rate of migration relative to control untreated group is plotted. Data represents from three independent experiments. P values were determined by an unpaired two-tailed Student’s t-test. *P < 0.05; **P < 0.01; ****P < 0.0001.