Figures & data
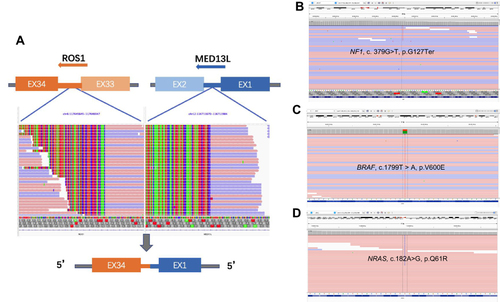
Figure 1 Diagram of patient’s treatment history and clinical course. (A) Timeline of treatment; (B) Change of tumor lesions upon the combined treatment with dabrafenib, trametinib and lorlatinib. The arrow denotes pericardial or pleural effusion; Two months after the treatment beginning, both pericardial and effusions declined; lung lesion remained stable; Three months after the treatment beginning, the arrow denotes the increased pleural effusion, lung lesion remained stable.
Abbreviations: ARMS-PCR, amplification refractory mutation system PCR; FISH, fluorescence in situ hybridization; IHC, immunohistochemistry; NGS, next-generation sequencing; AP, pemetrexed + cisplatin; PR, partial response; SD, stable disease; PFS, progression-free survival; TTF, time to treatment failure.
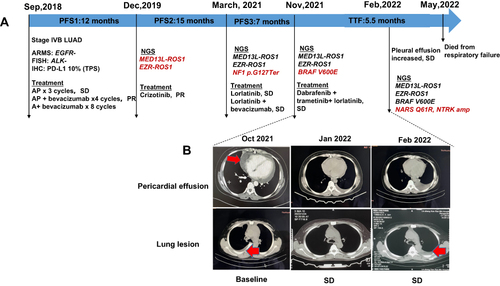
Table 1 List of Alterations Detected by NGS
Figure 2 IGV illustration of ROS1 novel fusion and potential drug-resistant mutations. (A) MED13L-ROS1(M1:R34); (B) NF1 p.G127Ter; (C) BRAF, c.1799T > A, p.V600E; (D) NRAS, c.182A>G, p.Q61R.