Figures & data
Figure 1 Construction flow of PDX models for NSCLC.
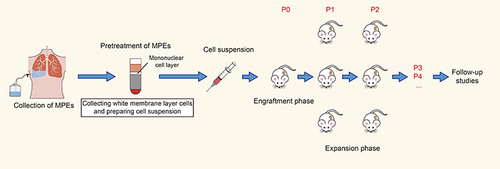
Figure 2 The PDX models are consistent with the histological. Tumor tissues from patient (NO.11) and the P4 generation PDX model were fixed and examined with H&E staining.
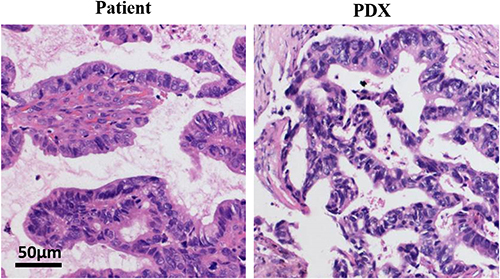
Figure 3 The PDX models have the same protein expression pattern with the original tumor.
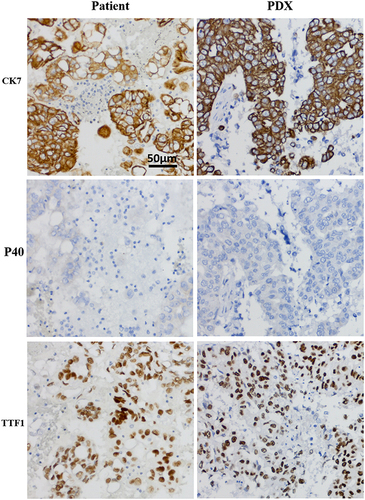
Figure 4 PDX tissue and tumor tissue are the same individual origin by STR profile.
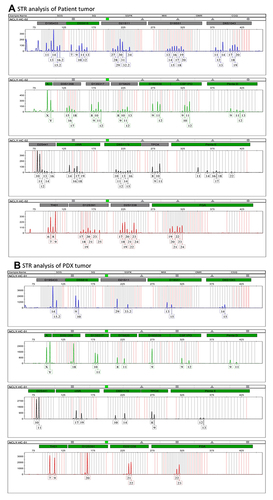
Table 1 Baseline Characteristics of Participants in the Study (N = 31)
Table 2 Log Rank Test to Compare the Relationship Between Survival Period and Tumor Development
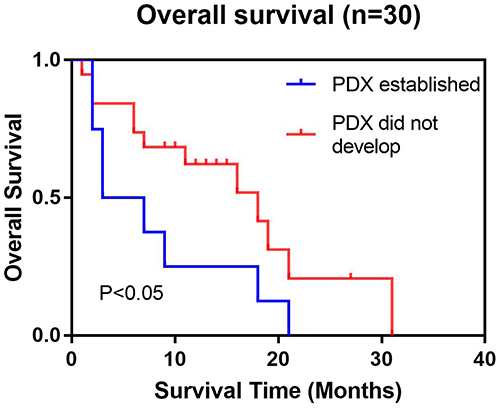
Figure 5 The survival rates of the patients corresponding to the successful establishment of PDXs were significantly lower. The survival curves of the groups with successful PDX establishment and those without successful PDX establishment showed significant differences in survival.