Figures & data
Figure 1 Patient recruitment process.
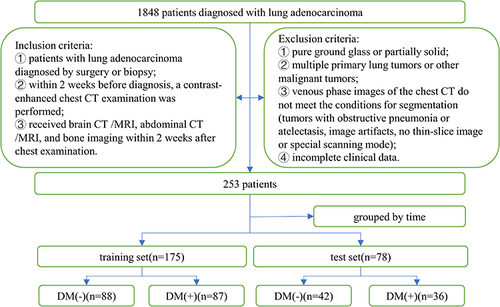
Figure 2 Flowchart of this study: 3D and 2D ROI segmentation (A), feature extraction (B), feature selection and model development (C), and model evaluation (D).
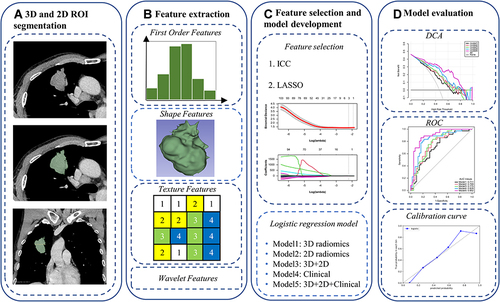
Table 1 Univariate Analysis of the Training Set and the Test Set
Table 2 Multivariate Logistic Regression Analysis of the Training Set
Table 3 Performance Evaluation of Five Models in the Training Set and the Test Set
Figure 3 Receiver operating characteristic curves of five models in training set (A) and test set (B).
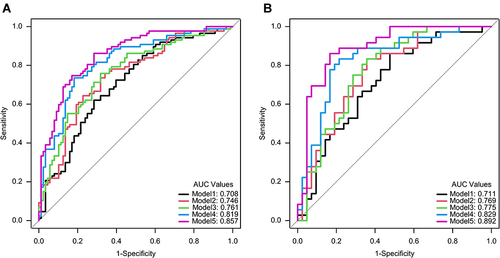
Figure 4 Decision curve analysis for five models in training set (A) and test set (B). The y-axis represents the net benefit and the x-axis represents the threshold probability. The black, red, green, blue, and purple lines represent the net gains for model 1, model 2, model 3, model 4, and model 5, respectively. The gray line represents the assumption that all patients had distant metastases. The black line represents the assumption that all patients had no distant metastases.
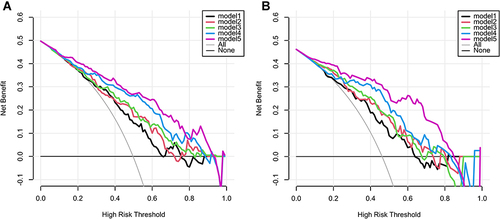
Figure 5 Nomogram for model 5.
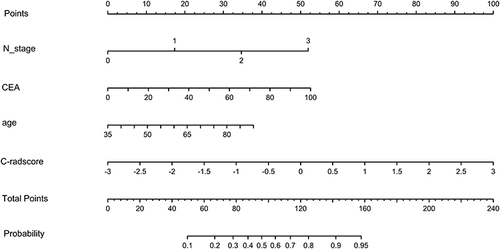
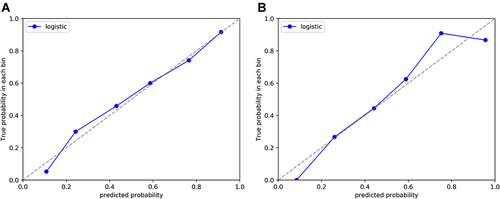
Figure 6 Calibration curves of model 5 in training set (A) and test set (B).