Figures & data
Table 1 Patient Clinical Information of ccRCC Datasets
Figure 1 Flowchart of the strategy to identify immune-related prognostic lincRNAs in ccRCC.
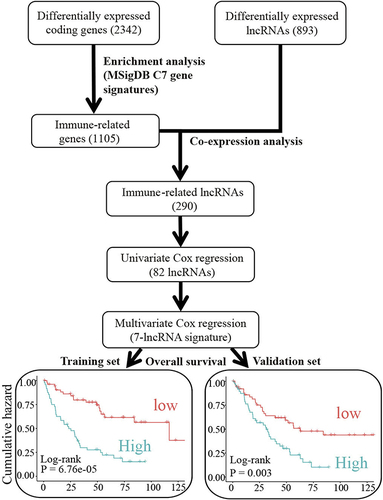
Figure 2 Identification of ccRCC-related lncRNAs and immune-associated coding genes. (A) Identification of differentially expressed (DE) protein-coding genes between ccRCC tumor sample and normal controls based on TCGA and GEO databases. (B) Identification of DE lncRNA between tumor and normal. (C) Gene set enrichment analysis of DE protein-coding genes based on MSigDB C7 immunologic signatures. Genes and signatures with Benjamini-Hochberg (BH) adjusted P-value < 0.05 were significant.
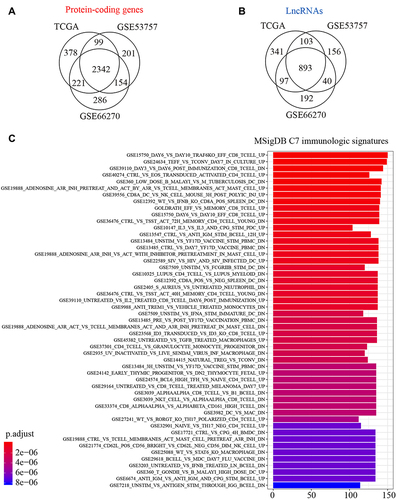
Figure 3 Identification of immune-related lncRNAs in ccRCC. Pearson correlation coefficient matrix of 290 differentially expressed lncRNAs (y-axis) and 1105 immune-related protein-coding genes (x-axis). For better visualization, the cells in the heatmap (correlation of specific gene-lncRNA pair) with BH-adjusted P < 0.05 and Pearson correlation coefficients |r| < 0.4 were considered no significance and were replaced with zero. The Euclidean distance metric with Ward linkage was used for hierarchical clustering of the correlation matrix. The functional classification of the four clusters of immune-related genes was performed based on MSigDB C7 signatures (BH-adjusted P < 0.05 was used as a cut-off value).
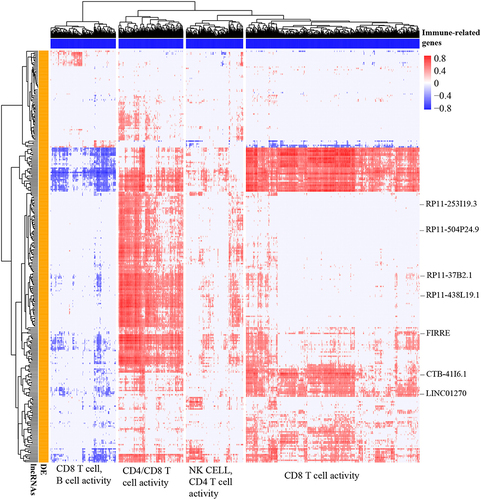
Table 2 The Univariate and Multivariate Cox Proportional Hazard Model for Stage III/IV ccRCC Patients
Figure 4 The prognostic potential of our 7-lncRNA signature. (A) The expression of the seven lncRNAs in the TCGA cohort. (B and C) Overall survival of patients with late-stage ccRCC in training (TCGA, n = 162) and validation datasets (ICGC, n = 158). The prognostic index (Pindex) was calculated based on the expression and Cox regression coefficients of the seven lncRNAs. The median value of Pindex was used as a cut-off to divide patients into high- and low-Pindex groups.
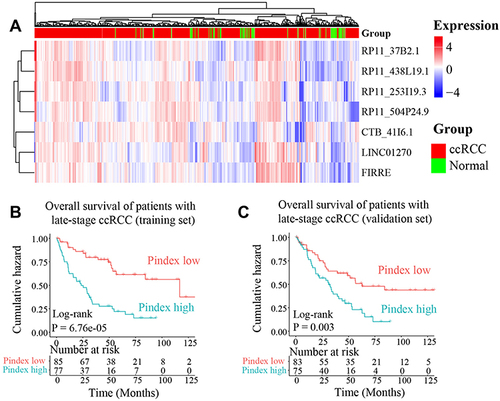
Figure 5 The correlations between PD-1/PD-L1/CTLA4 and the 7 lncRNAs in ccRCC. The three genes PD-1/PD-L1/CTLA4 are the most effective drug targets of immune checkpoint blockade therapy. The Pearson correlation was used in this analysis.
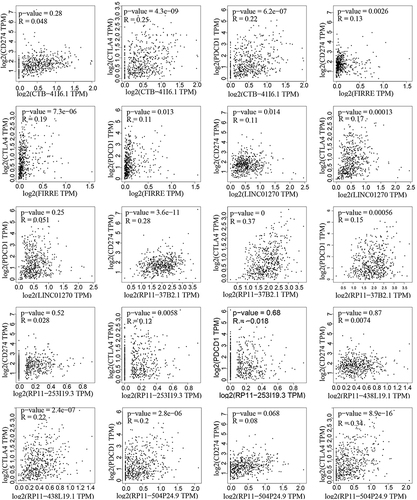
Figure 6 The functions and pathways of the 7 lncRNAs. (A) The KEGG pathways analysis enriched based on the protein-coding genes associated with the 7 lncRNAs. (B–D) The GO cellular components, molecular function, and biological process enrichment results, respectively.
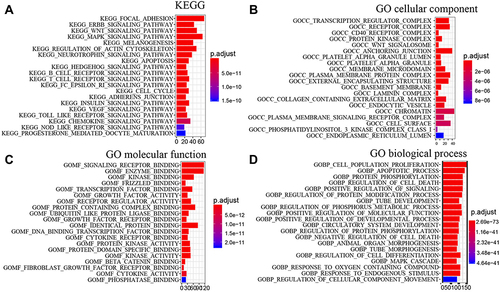
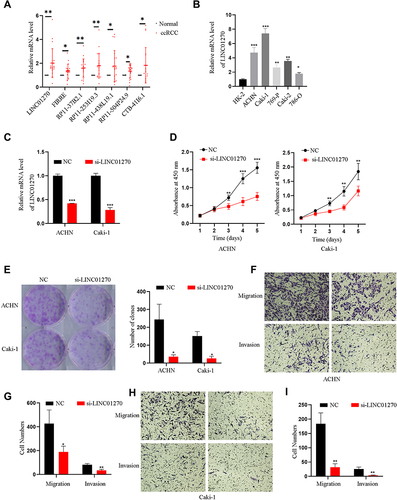
Figure 7 Experimental validation for the expression and function of LINC01270. (A) The differential expression level of seven lncRNAs between renal clear cell carcinoma tissues (n=20) and their paired normal tissues were detected by qRT-PCR. (B) The differential expression levels of LINC01270 between renal clear cell carcinoma cells and human renal tubular epithelial cells HK-2 cells were measured by qRT-PCR. (C) The transfected efficiency of LINC01270 was measured using qRT-PCR. (D and E) The CCK-8 and colony formation assays were used to detect cell proliferation ability. (F–I) The migration and invasion were used to measure the cell migration and invasion ability. *p<0.05; **p<0.01; ***p<0.001.