Figures & data
Table 1 Baseline Characteristics
Table 2 First-Line Therapy
Table 3 Estimated Marginal Means of the EORTC QLQ-C30 and the QLQ-LC29
Figure 1 Cumulated symptom scales (EORTC QLQ-C30 and LC29) (n=198). Marked in diagram, median, statistical mean (x) and smallest cumulative value (I).
Abbreviations: EORTC, European Organization for Research and Treatment; n, number.
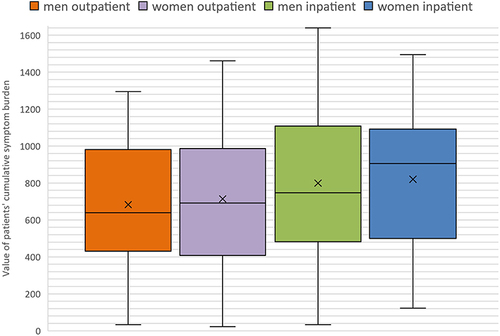
Figure 2 Cumulated function scales (EORTC QLQ-C30 and LC29) (n = 198). Marked in diagram, median, statistical mean (x) and smallest cumulative value (I).
Abbreviations: EORTC, European Organization for Research and Treatment; n = number.
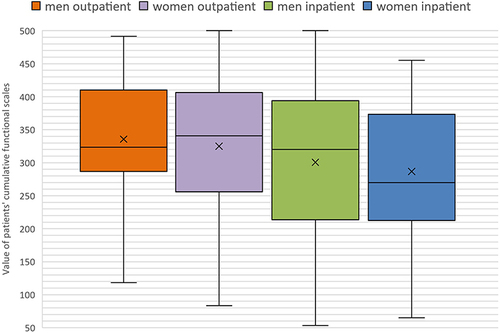
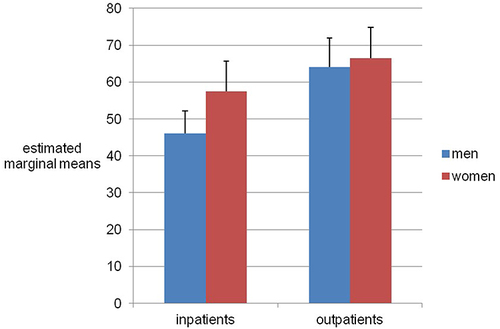
Figure 3 Quality of life separated by gender and inpatients versus outpatients (Estimated marginal means of the EORTC QLQ-C30). The error bars show the 95% percentile. p-value women inpatient/outpatient=0.095. p-value men inpatient/outpatient <0.001.
Abbreviation: EORTC, European Organization for Research and Treatment.