
Figures & data
Table 1 Patient Demographics
Figure 1 Kaplan–Meier survival curves of overall survival (OS).
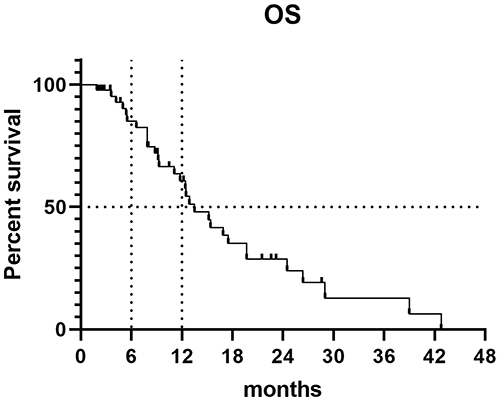
Table 2 Multivariate Analysis of the Effect of the Chosen Parameters on OS
Figure 2 Kaplan–Meier survival curves of overall survival (OS) by treatment history (A: previously treated with both VEGF inhibitors and S-1; B: not previously treated with both VEGF inhibitors and S-1).
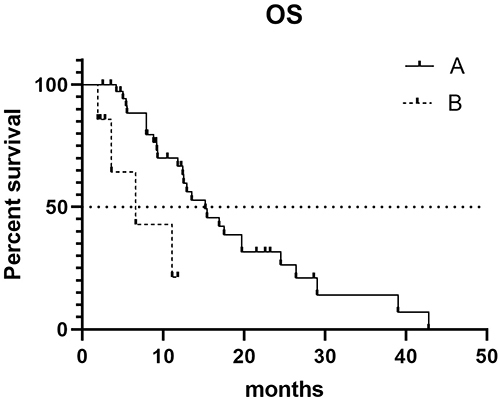
Table 3 Response of Patients with Measurable Disease (N = 43)
Figure 3 Kaplan–Meier survival curves of progression-free survival (PFS).
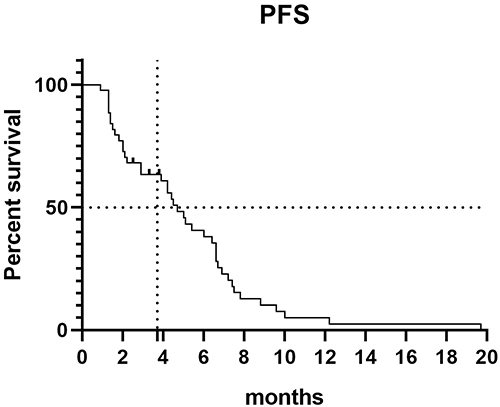
Table 4 Adverse Events