
Figures & data
Table 1 Baseline Characteristics
Table 2 Treatment Compliance with Preoperative Chemoradiotherapy and Consolidation Chemotherapy
Figure 1 Flow chart of preoperative chemoradiotherapy in patients with rectal cancer.
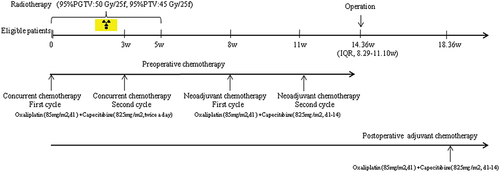
Table 3 Subgroup Analysis for Overall Survival (OS)
Figure 2 Overall survival (OS). (A) All patients in the study. (B) Achieved pCR vs None achieved pCR, P = 0.013. (C) Sphincter preservation vs Non- sphincter preservation in patients with low rectal cancer, P = 0.740.
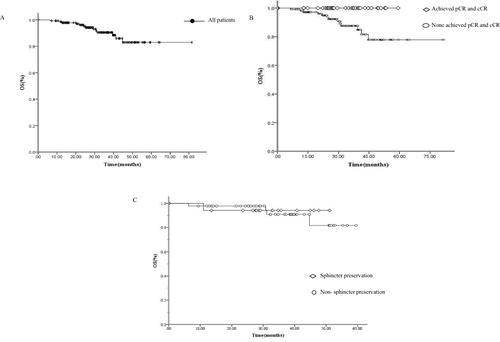
Table 4 Acute Adverse Effects in Patients After Received Preoperative Chemoradiotherapy
Table 5 Postoperative Complications in Patients After Received Preoperative Chemoradiotherapy