Figures & data
Figure 1 The forest plot exhibits the associations between iron metabolism related genes and prognosis in TCGA-LUAD cohort patients.
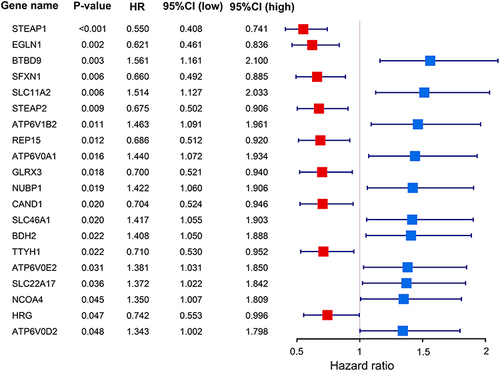
Figure 2 The expression levels of 20 iron metabolism related genes between LUAD and adjacent normal tissues in TCGA-LUAD dataset. (A) Heatmaps show the gene expression levels of 20 iron metabolism related genes and PDCD1 and CD274 in the TCGA-LUAD dataset. (B) The red points represent the normalized mRNA expression levels of iron metabolism related genes in 498 TCGA-LUAD tumor tissues while the green points represent the normalized mRNA expression level in 58 adjacent normal tissues. The P-values derived from the Student’s t-tests are shown.
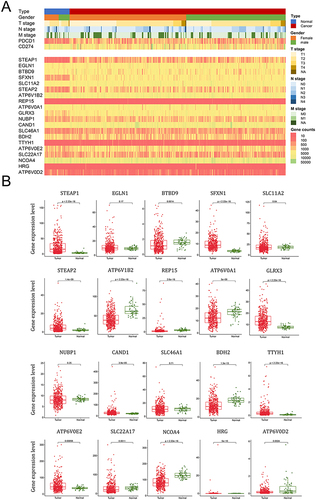
Figure 3 The Kaplan-Meier survival plots of the LUAD patients in GEPIA 2 database. The Kaplan–Meier plots of ten genes that are significantly associated with the prognosis of LUAD patients in GEPIA 2 database (N = 478). Patients were stratified by the median expression level of genes and compared using the Log rank tests.
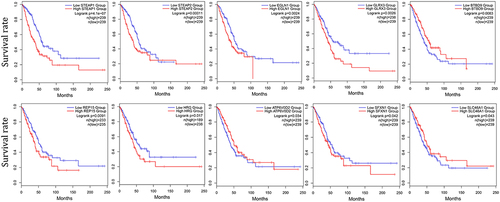
Figure 4 The protein-protein interaction (PPI) network and gene expression correlations between 20 genes. (A) The protein–protein interaction (PPI) network inferred by the STRING database The nodes represent proteins and the edges represent protein-protein interactions. (B) The heatmap shows the correlation coefficient between genes in 498 TCGA-LUAD tumor tissues. ***P < 0.001, **P < 0.01, *P < 0.05. (C) The PPI network of 20 iron metabolism related genes visualized by the GeneMANIA database.
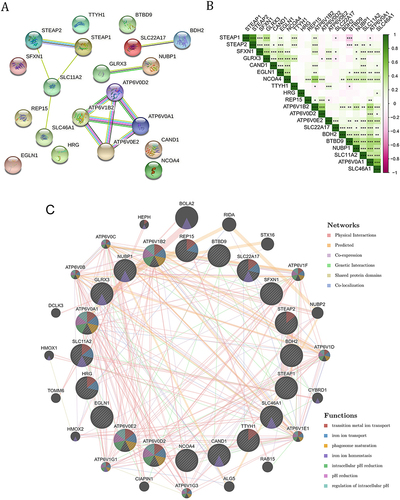
Figure 5 Associations between STEAP1 and STEAP2 protein levels and the prognosis in LUAD patients. (A) Heatmaps show the IHC staining results of STEAP1 and STEAP2 of 30 LUAD patients as well as corresponding clinical features. (B) Representative immunohistochemistry images of LUAD tissue with higher or lower STEAP1/2 expression level (×200). (C) The Kaplan–Meier plots of the overall survival in LUAD patients with higher or lower STEAP1 and STEAP2 expression levels according to IHC staining scores. P-values derived from the Log rank tests were labeled.
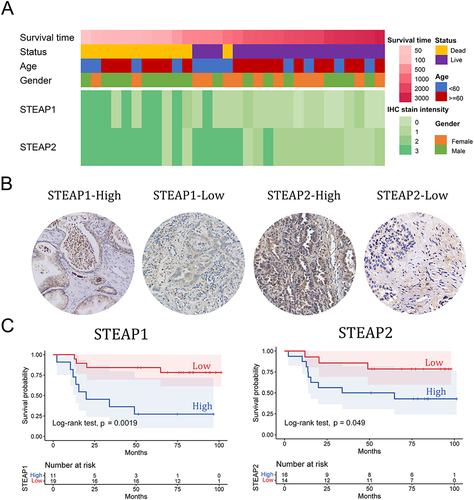
Figure 6 Correlations between 20 iron metabolism related genes and immune activities in TCGA-LUAD tissues. (A) Correlations between 20 iron metabolism related genes and immune activity scores (cell recruiting) in TCGA-LUAD tumor tissues. (B) Correlations between 20 iron metabolism related genes and immune cell infiltration (relative proportion of tumor-infiltration immune cells) in TCGA-LUAD tumor tissues. ***P < 0.001, **P < 0.01, *P < 0.05. (C) The correlation of STEAP1 and STEAP2 expression level with immune cells validated by the TIMER database.
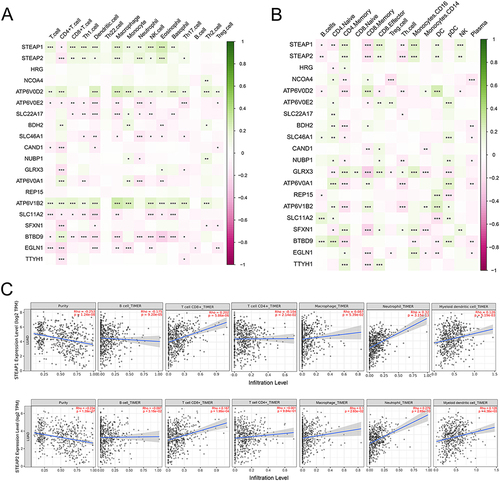
Figure 7 Differential STEAP1 and STEAP2 gene expression levels in TCGA-LUAD tissues with or without distinct gene mutations. The red point shows the mRNA levels in samples with indicated gene mutation and the green point represents tissues without gene mutation.
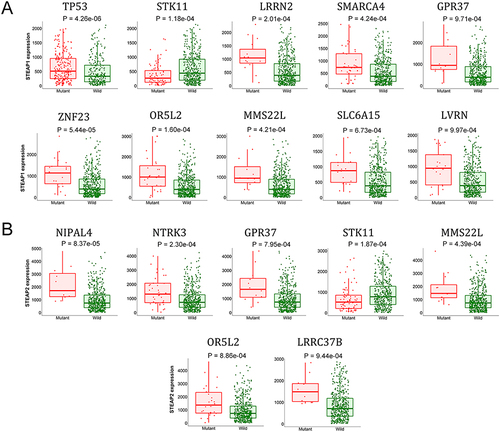
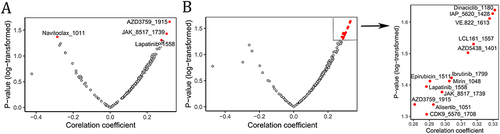
Figure 8 Correlations between STEAP1 and STEAP2 gene expression levels and molecule/drug sensitivity in LUAD cell lines. The X-axis represents the Pearson correlation coefficient between genes STEAP1 (A) and STEAP2 (B) and IC50 and 181 compounds in 54 kinds of LUAD cell lines derived from GDSC database. The corresponding P-values are shown on the Y-axis. Each dot shows individual compound and the significant dots (P < 0.05) are colored red and labeled.