Figures & data
Table 1 Patient Characteristics by Race (A) and Care Provider (B)
Table 2 Cox Regression on Overall Survival
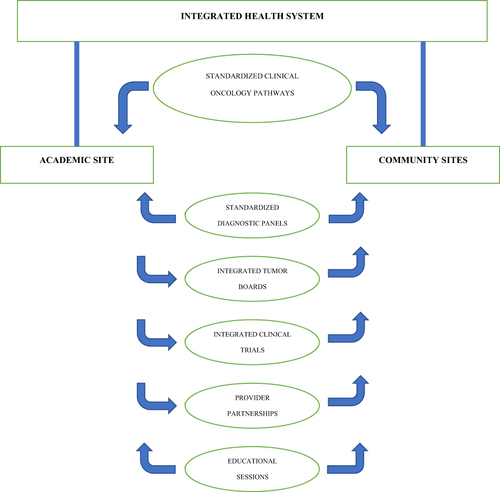
Figure 1 Kaplan–Meier estimation of overall survival by care provider type.
Notes: The median survival (95% CI) was 15.8 (13.7, 19.2) months for patients who were treated by a DOP. The median survival (95% CI) was 8.7 (6.4, 10.3) months for patients who were treated by a COP. There was a significant difference in OS between DOPs and COPs (p < 0.001).
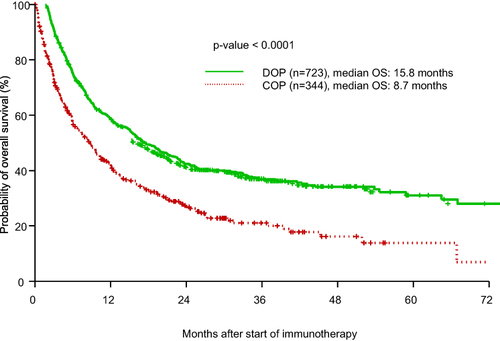
Table 3 The Results from Cox Regression with Death as Competing Risk (Fine and Gray Method) on Time to Adverse Event (TTAE)
Figure 2 Graphical representation of suggested academic and community site integration measures to address provider disparities.
Note: Arrow directionality represents which providers will receive primary benefit from the suggested measure (ie, integrated tumor boards will primarily benefit community oncology providers).