
Figures & data
Table 1 Construction and an Optimal Cut-Off Value of Each Indicator
Table 2 Baseline Characteristics of Patients
Table 3 Hazard Ratio (HR) and Regression Coefficient (β) of Each Index and Corresponding Score
Figure 1 The least absolute shrinkage and selection operator (LASSO) Cox regression model was used to select the elements to build inflammation-based prognosis score (IBPS), and the Kaplan–Meier analysis was used to generate survival curves between different IBPS groups. (A) A correlation matrix with correlation coefficients from −1 (negative correlation; red) to 1 (positive correlation; blue). (B) The LASSO coefficient profiles of inflammatory biomarkers. (C) Tuning parameter (λ) selection cross-validation error curve. (D) Survival curves in the training cohort (E) Survival curves in the validation cohort.
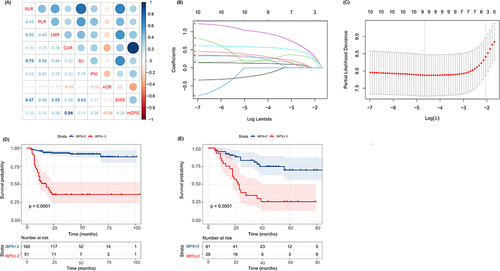
Table 4 Univariate and Multivariate Analysis of the Training and Validation Cohorts
Figure 2 The nomogram for predicting the overall survival (OS) in patients with diffuse large B-cell lymphoma (DLBCL). The total points are calculated as the sum of the individual scores of each of the four variables included in the nomogram.
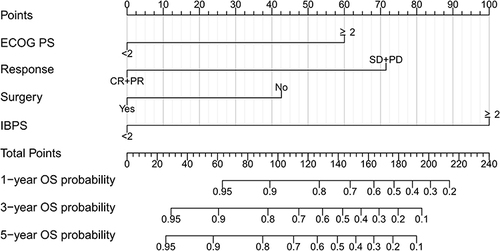
Figure 3 Receiver operating characteristic (ROC) verified the predictive value of nomogram, International Prognostic Index (IPI), and National Comprehensive Cancer Network (NCCN)-IPI in different sets. (A) ROC for 1-year OS in the training set; (B) ROC for 3-year OS in the training set; (C) ROC for 5-year OS in the training set; (D) ROC for 1-year OS in the validation set; (E) ROC for 3-year OS in the validation set; (F) ROC for 5-year OS in the validation set.
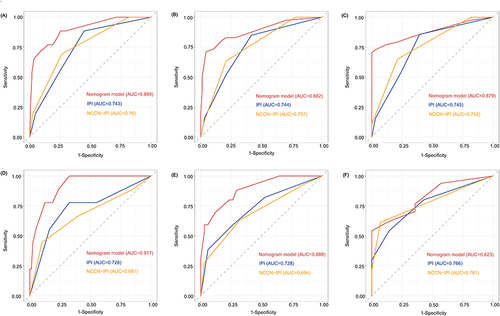
Figure 4 Calibration plot of the 1-, 3-, and 5-year OS nomogram in training and validation sets. (A) 1-year OS in the training set; (B) 3-year OS in the training set; (C) 5-year OS in the training set; (D) 1-year OS in the validation set; (E) 3-year OS in the validation set; (F) 5-year OS in the validation set.
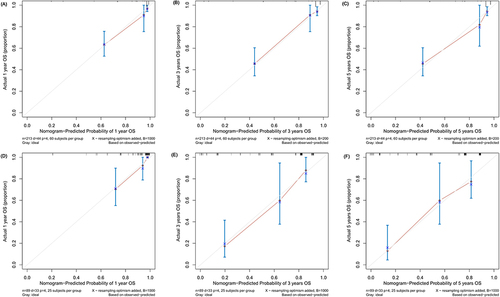
Figure 5 Clinical net benefits and risk stratification of nomogram. (A) Net benefit curves based on nomogram as compared with IPI and NCCN-IPI model in the training set; (B) Net benefit curves based on nomogram as compared with IPI and NCCN-IPI model in the validation set; (C) The survival curves for OS based on the prediction of nomogram in the training set; (D) The survival curves for OS based on the prediction of nomogram in the validation set.
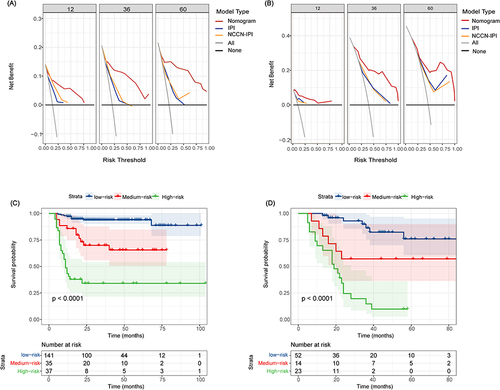
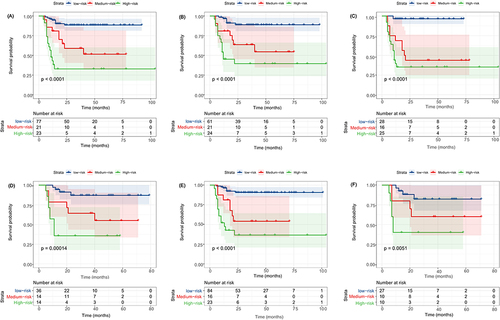
Figure 6 Kaplan–Meier curve of OS of DLBCL patients in different subgroups stratified according to risk stratification system in the training cohort. (A) OS of age >60; (B) OS of Ann Arbor Stage III/IV; (C) OS of LDH≥ 245U/L; (D) OS of BCL2 ≥50%; (E) OS of MYC ≥40%; (F) OS of MYC ≥40% and BCL2 ≥50%.
Data Sharing Statement
Data can be made available by contacting the corresponding author.