Figures & data
Table 1 Baseline Characteristics of HCC Patients in PDW Group
Figure 1 The ROC curve of HCC recurrence diagnosed by PDW.
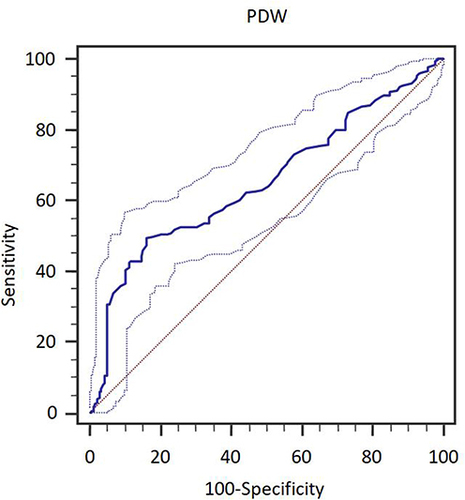
Figure 2 The correlation between PDW levels and disease free survival in patients with HCC. The cumulative recurrence was significantly higher in patients with PDW≥17.1 groups.
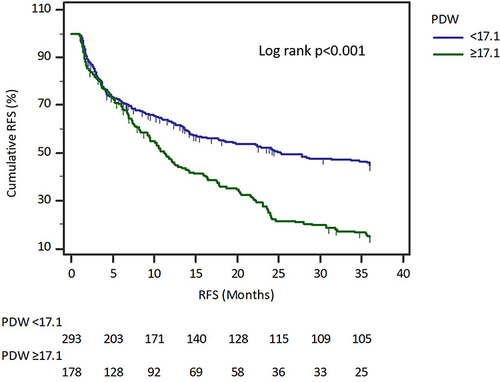
Table 2 The Univariate and Multivariate Analysis of Disease-Free Survival in HCC Patients
Figure 3 Nomogram predicting 3-year recurrence in HCC after surgery.
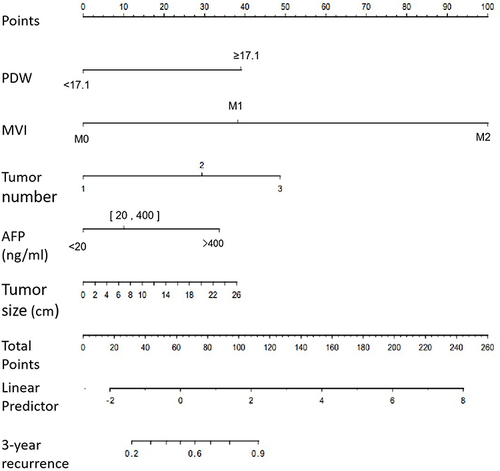
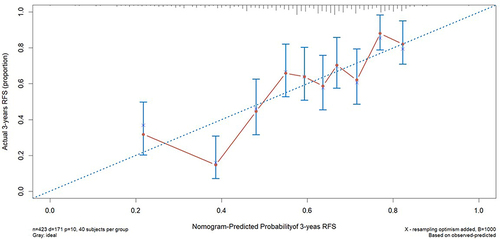
Figure 4 The bootstrapped calibration plot for the prediction of 3-year recurrence-free survival was shown. The blue line represents the ideal result; Red circles represent nomogram-predicted probabilities; “×” represent the bootstrap-corrected estimates; and error bars represent the 95% CIs of these estimates.