Figures & data

Figure 1 Immune cells in BM and PB from patients with MM expressed high levels of CD73. (A) Representative analysis of CD73 expression in T-, B-, and NK-lymphocytes and monocytes of BM. (B) Representative analysis of CD73 expression in T-, B-, and NK-lymphocytes and monocytes of PB. (C) Quantitative comparison of CD73 expression in T-, B-, and NK-lymphocytes and monocytes of BM and PB.
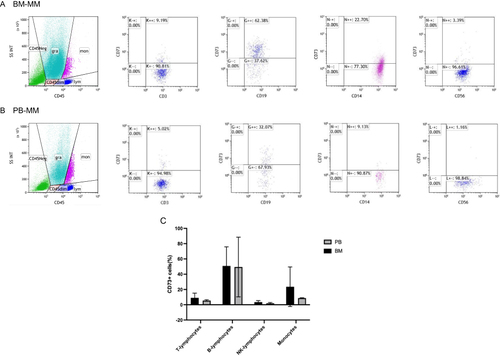
Figure 2 Expression of CD73 in PB monocytes isolated from patients with MM. (A) Comparative analysis of CD73 expression in PB monocytes: healthy controls (top) vs patients with MM (bottom). (B) Quantitative comparison of CD73 expression in PB monocytes from healthy controls and patients with MM. The expression of CD73 in T-, B-, and NK-lymphocytes of PB from patients with MM lower than from healthy controls; ***P < 0.001/P < 0.000.
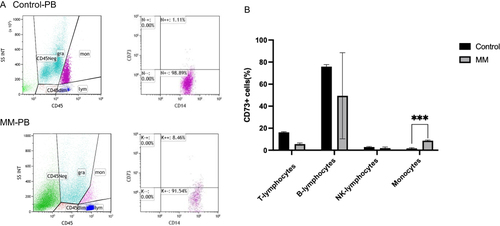
Figure 3 PB monocytes from patients with MM exert pro-tumor effects. The PB monocytes from patients with MM (M-MØ) or healthy control (H-MØ) samples were co-cultured with myeloma cells (RPMI-8226) for 12 h. (A) Flow cytometry analysis showing the residual CD138+ cells in the healthy control (top) and MM (bottom) groups. (B and C) Levels of IL-2, TNF-α, IFN-γ, IL-4, IL-6, and IL-10 in monocytes from patients with MM and healthy controls (B) before co-culture with RPMI-8226 cells and (C) after co-culture in the supernatant. (D) Phagocytic index in myeloma cells in the monocytes from patients with MM (bottom) and healthy controls (top) after co-culture with RPMI-8226 cells. ① Monocytes; ② myeloma cells; ③ monocyte phagocytosis of myeloma cells. (E and F) Levels of IL-2, TNF-α, IFN-γ, IL-4, IL-6, and IL-10 in monocytes from the (E) healthy controls group and (F) patients with MM group before and after the co-culture of the samples with RPMI-8226 cells; *P < 0.05, **P < 0.01, ***P < 0.001.
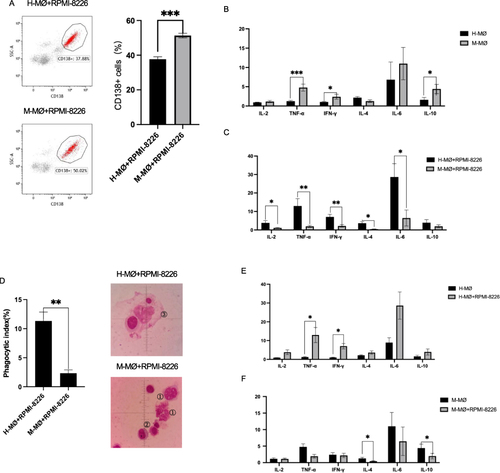
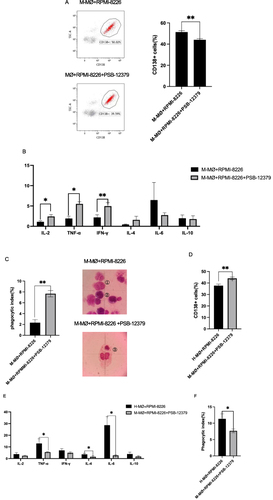
Figure 4 Inhibiting CD73 improves the anti-tumor immunity in BM immune cells isolated from patients with MM. BMMCs from patients were either untreated or treated with 10 μg/mL PSB-12379 for 12 h. (A) Flow cytometry analysis showing the residual CD138+ cells in the BMMCs culture of the groups treated with or without PSB-12379. The bar graph shows the quantitative comparison of the residual CD138+ cells in the BMMCs culture in the two groups. (B) Levels of IL-2, TNF-α, IFN-γ, IL-4, IL-6, and IL-10 in cells treated with or without PSB-12379. (C) The number of monocytes that underwent phagocytosis in myeloma cells was not significantly different between PSB-12379-treated and untreated groups; *P < 0.05.
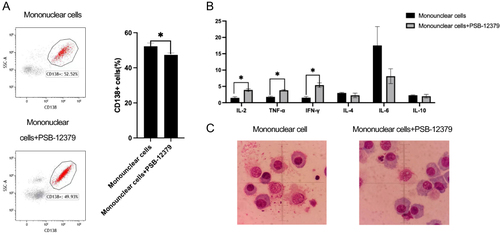
Figure 5 Inhibiting CD73 enhances the anti-tumor immunity of patient monocytes. Monocytes isolated from patients with MM were co-cultured with myeloma cells with or without 10 μg/mL PSB-12379. (A) Flow cytometry showing the residual CD138+ cells In the patient monocytes culture of the groups treated with or without PSB-12379. Monocytes treated with PSB-12379 (bottom) significantly increased the killing activity of CD138+ cells compared to the untreated cells (top). (B) Levels of IL-2, TNF-α, IFN-γ, IL-4, IL-6, and IL-10 in monocytes treated with or without PSB-12379. (C) Monocytes treated with PSB-12379 showing significantly higher monocyte phagocytosis in myeloma cells than in untreated monocytes. Almost no monocyte phagocytosis was observed when MM PB monocytes were co-cultured with myeloma cells (top), while significantly higher monocyte phagocytosis was observed when MM PB monocytes treated with PSB-12379 were co-cultured with myeloma cells (bottom). ① Monocytes; ② myeloma cells; ③ monocyte phagocytosis of myeloma cells. (D) The PB monocytes from healthy control samples had a significantly reduced residual of CD138+ cells compared with those treated with PSB-12379 from patients with MM. (E) The PB monocytes from healthy control samples had significantly higher TNF-α, IL-4, and IL-6 levels than those that were treated with PSB-12379 from patients with MM. (F) PB monocytes from healthy controls showing higher phagocytosis of CD138+ cells than those treated with PSB-12379 from patients with MM; *P < 0.05; **P < 0.01.