
Figures & data
Figure 1 Receiver operating characteristic curve was plotted to determine the best cut-off value for the PNI.
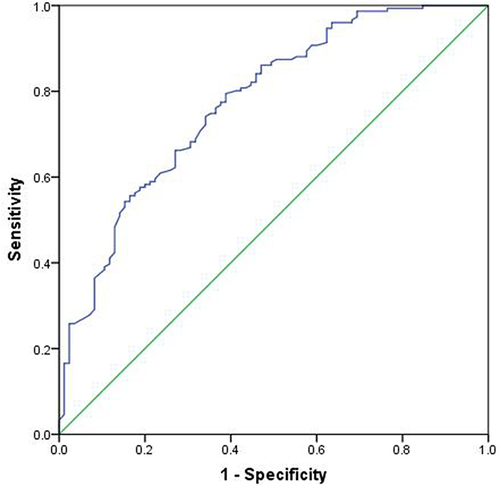
Table 1 Relationships Between PNI and Clinicopathological Before and After Propensity Score Matched
Figure 2 Kaplan-Meier curves of RFS based on PNI group in 143 patients with AGE.
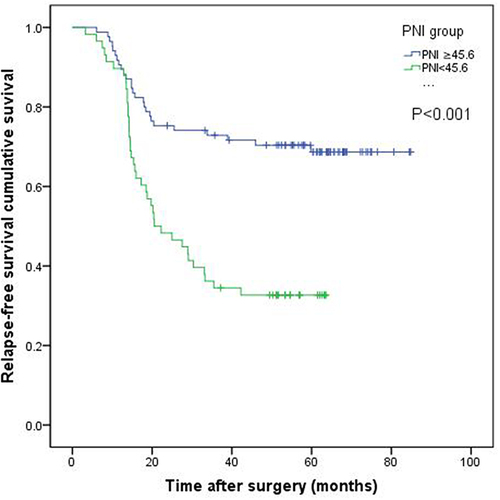
Figure 3 Kaplan-Meier curves of OS based on PNI group in 143 patients with AGE.
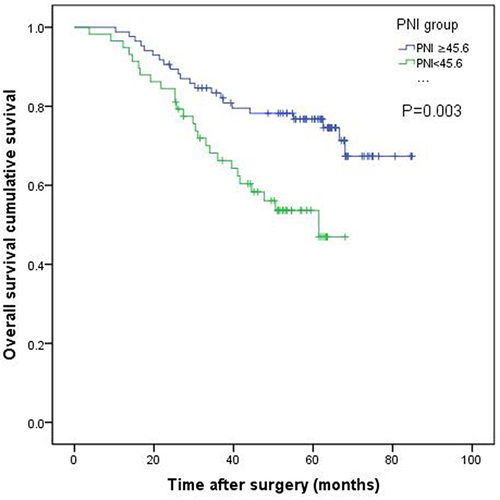
Table 2 Prognostic Factors for Overall Survival in Patients with AGE After Propensity Score Matching