Figures & data
Table 1 Descriptive Analysis of Study Participants
Figure 1 Analysis of CXCL12 mRNA expression levels in BC tissues. (A) Comparison of CXCL12 mRNA expression between BC and healthy tissue. (B) Comparison of CXCL12 mRNA expression between different BC subtypes. (C) Comparison of CXCL12 mRNA expression between different stages of BC.
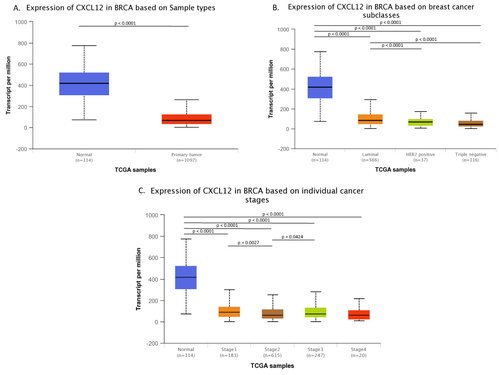
Figure 2 Analysis of CXCR4 mRNA expression levels in BC tissues. (A) Comparison of CXCR4 mRNA expression between BC and healthy tissue. (B) Comparison of CXCR4 mRNA expression between different BC subtypes. (C) Comparison of CXCR4 mRNA expression between different stages of BC.
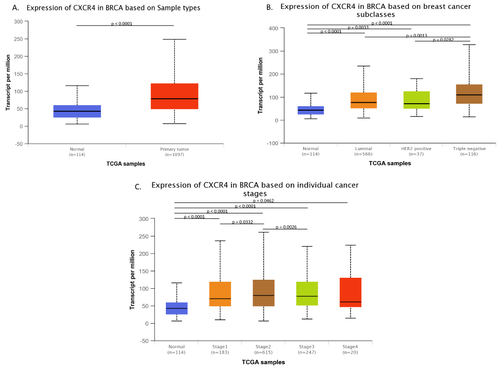
Table 2 Concentrations of CXCL12, CXCR4 and CA 15-3 in Individual Study Groups (Median Concentrations and Interquartile Ranges (IQR))
Figure 3 CXCL12 concentrations in the study groups (including luminal A and B subgroups of BC) and control groups (fibroadenoma and healthy women). On the graphs were plotted the values of the median, interquartile range and the minimum and maximum values. Clusters indicate statistically significant differences between particular groups.
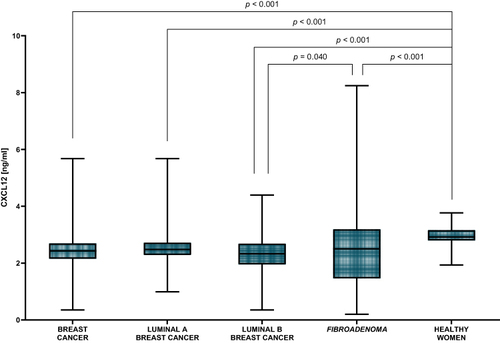
Figure 4 CXCR4 concentrations in the study groups (including luminal A and B subgroups of BC) and control groups (fibroadenoma and healthy women). On the graphs were plotted the values of the median, interquartile range and the minimum and maximum values. Clusters indicate statistically significant differences between particular groups.
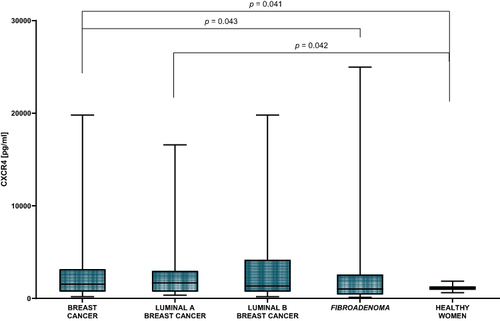
Figure 5 CA 15-3 concentrations in the study groups (including luminal A and B subgroups of BC) and control groups (fibroadenoma and healthy women). On the graphs were plotted the values of the median, interquartile range and the minimum and maximum values. Clusters indicate statistically significant differences between particular groups.
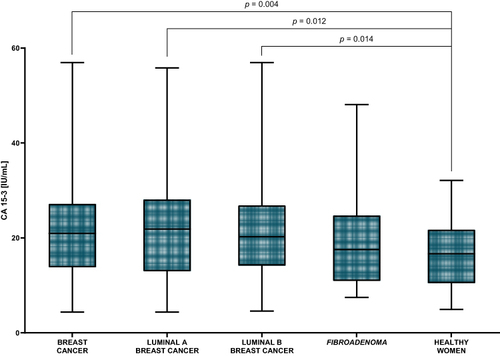
Figure 6 Heatmaps of correlation matrix for tested groups: (A) – BC total group of patients, (B) – luminal A subgroup (LumA) of patients, (C) – luminal B subgroup (LumB) of patients, (D) – women with fibroadenoma (FA), (E) – healthy women (HW).
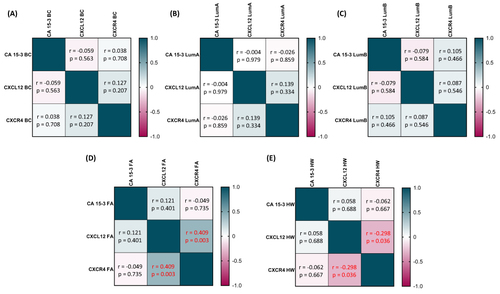
Table 3 Diagnostic Reliability of Univariate and Multivariate Parameters in the Respective Study Groups
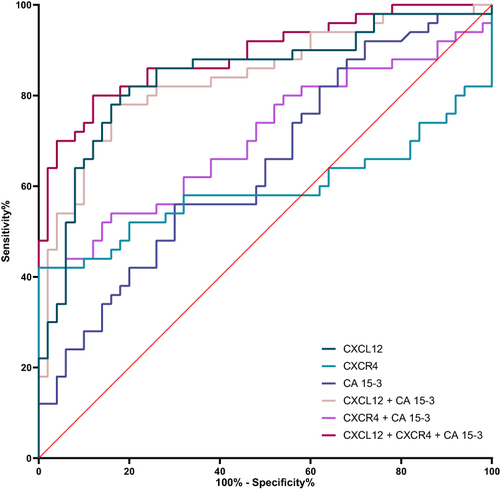
Table 4 ROC Curves Characteristics for Univariate and Multivariate Parameters in the Respective Study Groups with the Assessment of the Quality of the Test Against the Comparative Marker CA 15-3
Figure 7 ROC curves of univariate and multivariate parameters in a group of BC patients.
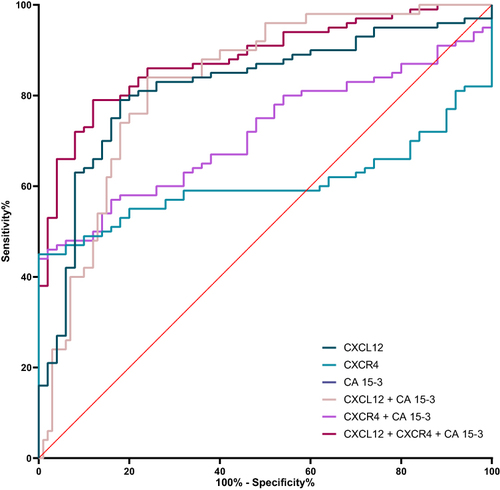
Figure 8 ROC curves of univariate and multivariate parameters in a group of in a luminal A BC subgroup of patients.
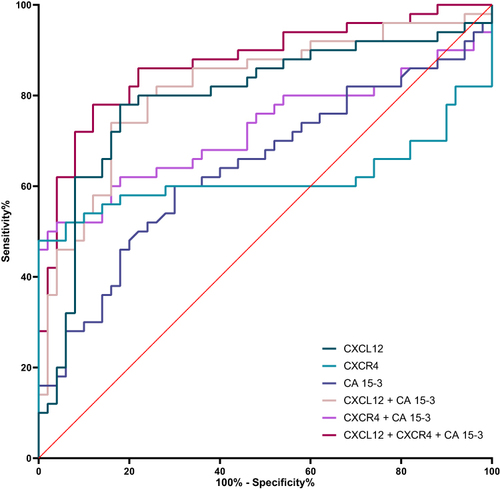
Figure 9 ROC curves of univariate and multivariate parameters in a group of in a luminal B BC subgroup of patients.